There is a parable about blind men who palpate an elephant. One claimed that the elephant was round and flexible, the second claimed that the elephant was rigid and upright, and the third claimed that the elephant was smooth and immense. All three were right, but only in their own way. By touching the particulars, blind people cannot understand the general shape of the elephant. Data insights are the results of data science, non-obvious but beneficial conclusions after processing a vast amount of data. The human mind cannot do this. With data insights, businesses can see the whole elephant and train it. If you are interested in this topic, please arrange a call—we will explain everything in detail.
Data Analysis Leads to Data Insights
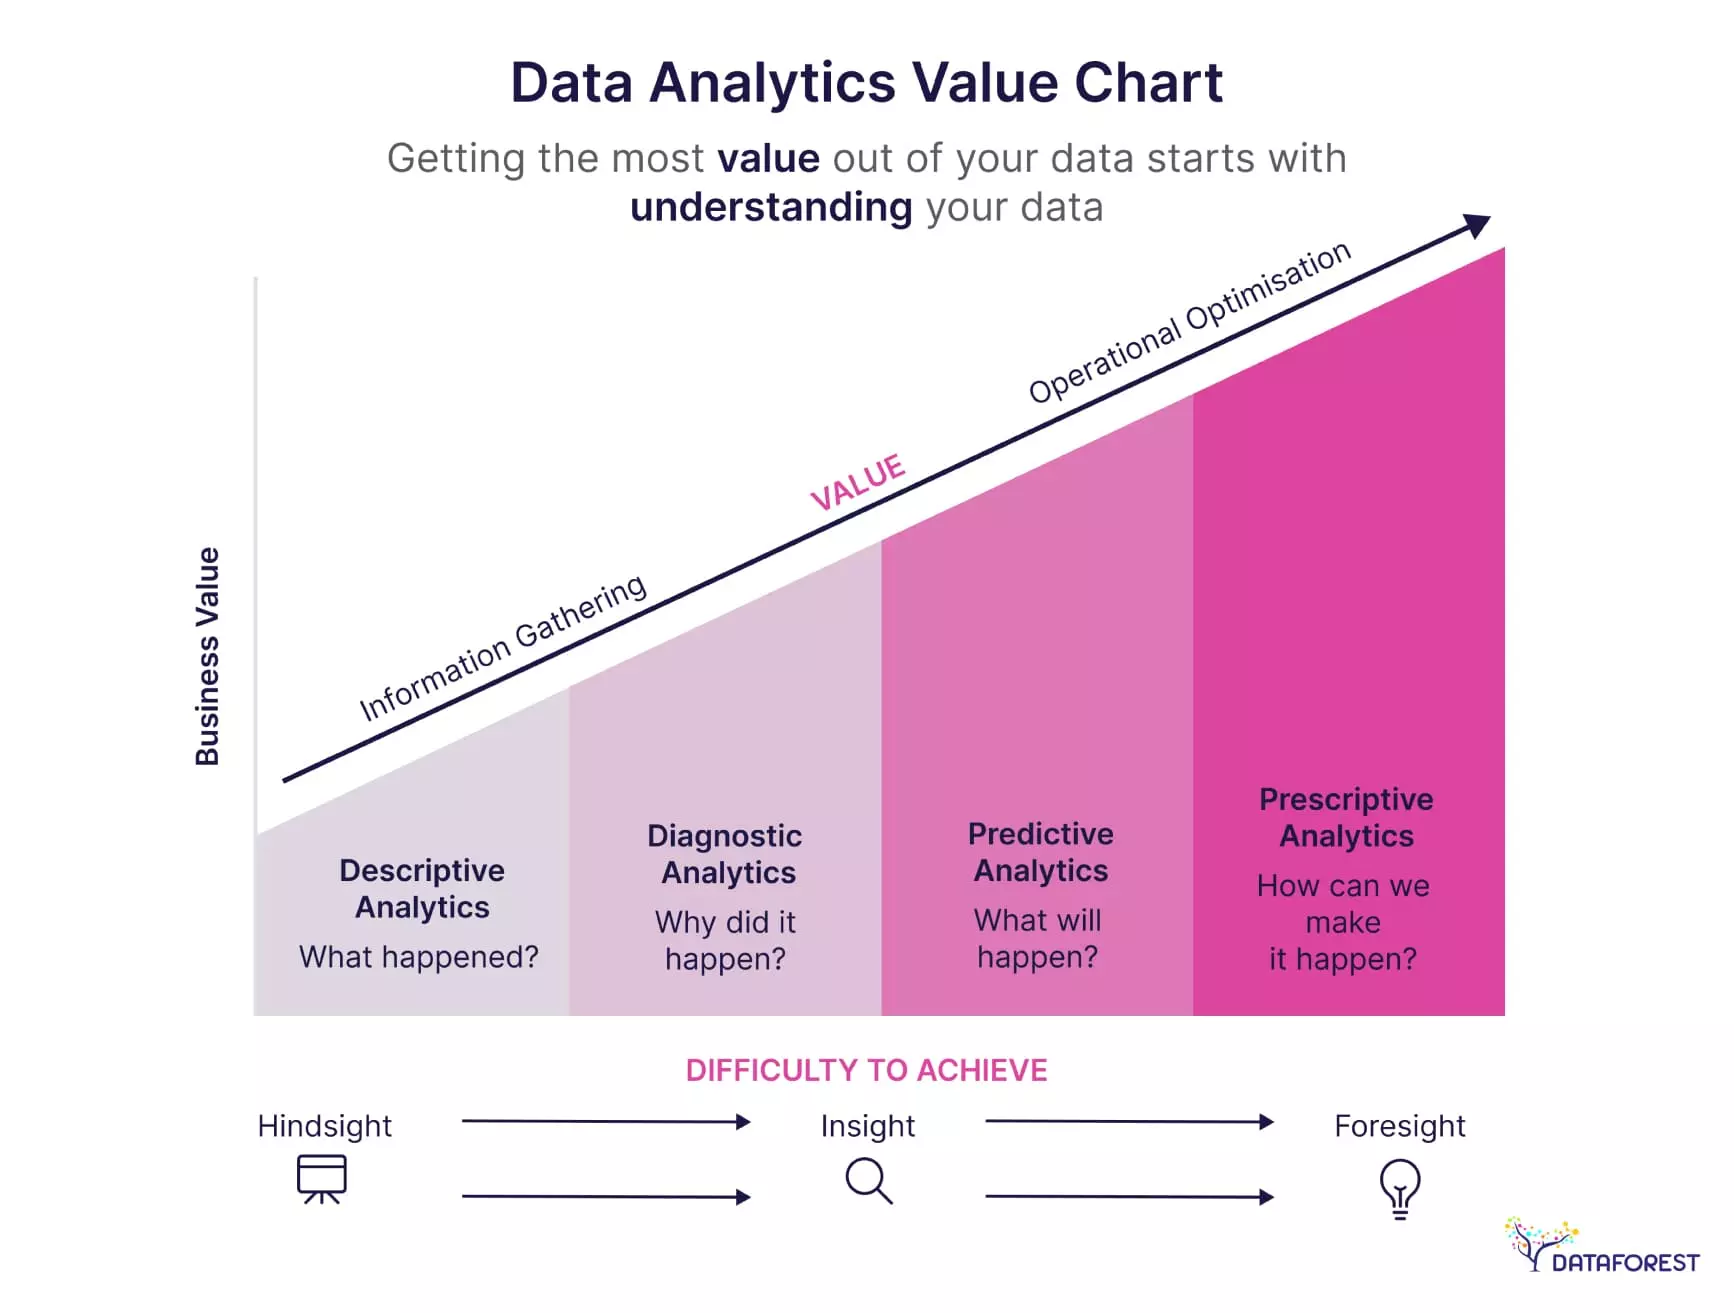
Data analysis is inspecting, cleaning, transforming, and modeling data to discover useful information. Data insights are the valuable and actionable findings that emerge from data analysis. They are the aha moments, the revelations you uncover after analyzing the data. Data analysis is the essential first step to getting data insights. Without analysis, you're just looking at raw data, which isn't very informative. Data analysis uses various techniques, such as statistical methods and data visualization tools, to uncover data insights.
What Is Data Insight
Data is like a pile of unpolished stones—exciting but not practical. Data insights are the process of transforming this raw data into something valuable. You identify patterns, trends, and relationships within the data through analysis. These patterns become the insights—they tell a story about the data's meaning. Data insights aren't just about a deep understanding of the past and guiding future actions. They provide answers to specific questions or illuminate hidden opportunities. This knowledge can be used to make better decisions.
Analyzing customer data might reveal a specific demographic more likely to respond to a marketing campaign. Sales data analysis could show which products are frequently bought together, suggesting upselling opportunities. Financial data insights help identify areas to cut costs or predict future financial trends.
From Raw Data to Riches
- It all starts with a question. What are you hoping to learn from the data? Are you trying to understand customer behavior, improve efficiency, or predict future trends? Having clear goals ensures you're looking for the right insights.
- Not all data is created equal. You need to identify the specific data points relevant to your goals. This might involve collecting data from various sources, such as customer surveys, website analytics, or sales records. Data cleaning and organization are crucial steps here.
- You'll use various techniques, such as statistical analysis, data visualization tools, and machine learning algorithms, to uncover patterns and relationships within the data.
- Data doesn't exist in a vacuum. It's essential to consider the context surrounding the data. Are there external factors influencing the patterns you see? A sudden spike in sales might be due to a seasonal trend, not a marketing campaign.
- After analyzing the data and considering the context, you finally translate your findings into actionable insights. These insights should be clear and concise and address your initial goals.
Data insights are only valuable if they are communicated effectively. Use clear visuals and storytelling, and avoid technical jargon to ensure everyone understands the data insights.
Wondering how to improve data insights?

Unveiling Insights—Data Sources in Data Analysis
Data sources are the foundation of any insights you can glean in the data analysis. They are the original wellsprings from which you extract the information for analysis. These sources can come in all shapes and sizes—databases, flat files, web services, or other applications.
Fueling Data Insights
Relational Databases: These are the cornerstones of data storage, meticulously organized warehouses holding massive amounts of information. Relational databases excel at structured data, allowing for complex queries and analysis.
Flat Files: Think of spreadsheets and CSV files. Flat files provide a straightforward way to store and access data, making them user-friendly for smaller datasets or quick explorations.
Streaming Data and Sensor Feeds: The world consists of constantly generated data. Sensor readings, social media feeds, and website traffic all fall into this category. Streaming data allows for real-time analysis, which is ideal for capturing fleeting trends or monitoring critical processes.
Web Services and APIs: Application Programming Interfaces act as gateways to vast data residing on web services. This opens doors to everything from weather information to social media sentiment, providing a wealth of external data points to enrich your analysis.
Self-Service Applications: Customer Relationship Management (CRM) systems, marketing automation platforms, and even project management tools can all be data sources, offering valuable insights into customer behavior, marketing campaigns, and project progress.
Internal vs. External Data Sources
In data analysis, the battle for insights often occurs on two key fronts: internal and external data sources. Each side offers unique perspectives, like two sides of a coin, that, when combined, can create a complete picture. Internal data is the chronicle of your organization's activities, the information you generate daily. External data provides a window to the outside world, providing valuable context and insights into the bigger picture.
We know how to handle Big Data; arrange a call and you will know too.
Structured vs. Unstructured Data in Data Insights
Data comes in two primary flavors in the data analysis: structured and unstructured.
Structured data is the well-organized citizen of the data world. Imagine it as neatly arranged rows and columns in a spreadsheet, where each data point has a predefined format and fits into a specific category. Structured data excels at calculations, trends, and statistical analysis. These are prime examples of sales figures, customer demographics, and website traffic data. The organized nature of structured data allows for powerful queries and filtering. Relational databases, a popular storage option for structured data, facilitate efficient manipulation. However, structured data can sometimes be a limited storyteller. It often needs more detail and context found in other data sources.
Unstructured data is the expressive counterpart of structured data. It encompasses emails, social media posts, images, videos, sensor readings, and anything that fits in a different format. It reveals opinions, sentiments, and experiences. Analyzing social media conversations can expose customer satisfaction or identify emerging trends. Techniques like natural language processing (NLP) unlock hidden patterns and meaning within unstructured data. Sentiment analysis of customer reviews can identify areas for improvement. Unstructured data offers a depth of understanding that structured data may lack. But it requires additional processing and sophisticated techniques.
The true power lies in combining structured and unstructured data. Imagine a symphony where the melodies of structured data harmonize with the rich textures of unstructured data. Unstructured data, such as customer reviews, adds context and meaning to structured data, such as sales figures. Insights gleaned from unstructured data can be validated by cross-referencing with structured data.
A 3-Step Process for Extracting Data Insights
- Data Collection involves gathering data from various sources. This data could be numerical (sales figures, website traffic), textual (social media comments, customer reviews), or visual (images, videos). Depending on your needs, there are many ways to collect data, from internal databases and surveys to public sources and web scraping.
- Data Analysis: Once you have data, you must organize and analyze it to identify patterns and trends. This uses data visualization tools to create charts and graphs or statistical software to perform more complex analyses.
- Data Insights: After analyzing the data, you can extract meaningful insights. These insights should be actionable and inform decision-making. For example, you might discover that a certain product category is more popular among a particular customer demographic, which could inform your marketing strategy.
The Foundation of Insight—Data Collection and Cleaning
Data Collection is all about acquiring the information to answer your specific question. Think of it like assembling a puzzle. There are various sources from which to gather data. Internal sources could be databases containing sales figures, customer information, or website traffic logs. External sources are publicly available datasets, surveys you conduct, or scraping data from websites.
Data comes in many formats, and you'll need to ensure compatibility for analysis. Be mindful of potential biases in your data source, which can skew insights.
Data in its raw form could be better. Cleaning involves meticulously examining and correcting inconsistencies to ensure the data is accurate and ready for analysis. This is like cleaning and organizing the puzzle pieces before assembling them.
Common Cleaning Tasks
Identifying and removing duplicates: Extra entries can distort an analysis.
Fixing formatting errors: Inconsistent dates, units, or abbreviations need correction.
Handling missing data: Decide how to address missing values (e.g., remove entries, fill with estimates).
Dealing with outliers: Extreme data points can skew results. Investigate or potentially exclude them.
Clean data leads to more reliable and trustworthy insights. It is easier to analyze and manipulate with software. Clean data ensures your findings are clear and understandable to others. It is the fuel that powers your analysis engine.
Data Analysis: The Hidden Picture
Data analysis manipulates data to identify patterns, trends, and relationships. Creating charts, graphs, and other visual representations helps us see them more easily. Line charts show trends over time, while bar charts compare categories. Statistical methods help to uncover deeper relationships between variables. This calculates averages and correlations or performs more complex tests. Selecting the most appropriate analysis techniques depends on the data type and research question. Be mindful of preconceived notions that might influence how you interpret the data.
During data interpretation, you translate the patterns revealed through analysis into insights. What stories do the patterns tell you? How do they answer your initial question? Don't interpret data in isolation—consider external factors that might influence the results. Acknowledge any limitations in your data collection or analysis methods.
Data insights empower you to make data-driven decisions that are more likely to succeed. They identify the root causes of problems and develop effective data insight solutions. Sometimes, data reveals unexpected patterns that lead to entirely new questions and areas of exploration.
Data-driven marketing


They developed solutions that brought value to our business.
Make data-driven decisions!

How Data Insights Drive Business Success
You transform data from a collection of numbers into a powerful tool for knowledge discovery and informed action by effectively analyzing and interpreting data. This is the culmination of your journey from data to insight, where you translate raw information into actionable insights that drive real-world value.
Boosting Sales with Targeted Marketing
A retail clothing store was experiencing stagnant sales growth. They suspected they needed to be more effectively reaching their target audience. The store gathered customer purchase data (demographics, purchase history) and website traffic data (user behavior, browsing patterns). They analyzed it to identify buying trends and standard demographics. Website shopper insight data revealed which products were most viewed by different demographics. Insights showed a mismatch between their marketing and customer demographics. They needed to target the right audience with the right products.
The store adjusted its marketing strategy based on the retail data insight. They tailored ads and promotions to specific customer segments, highlighting products with high appeal within those groups. This resulted in increased targeted sales and a more efficient marketing budget allocation.
Optimizing Inventory Management
A manufacturing company faced stock-out issues for certain products, leading to lost sales and customer dissatisfaction. They also carried excess inventory of other products, tying up capital and storage space. The company analyzed historical sales data, production records, and inventory levels. They used statistical methods to forecast future demand for each product and identify patterns in stock fluctuations. Data information insights revealed products with high demand variability and overstocked items with low sales velocity.
The company implemented a data-driven insight inventory management system. Based on predicted demand, they adjusted production schedules and ordering patterns. This reduced stock-outs, minimized excess inventory, and improved overall production efficiency.
Empower your team with actionable data!

Enhancing Patient Care
A hospital wanted to improve patient readmission rates, which were higher than desired, and identify factors contributing to these readmissions. The hospital collected patient medical records, admission/readmission data, and social determinants of health information. Statistical analysis was used to identify correlations between patient characteristics, diagnoses, and readmission rates. Insights revealed specific patient groups and medical conditions with higher readmission risks.
The hospital implemented targeted interventions for high-risk patients. This includes additional follow-up appointments or medication management programs. This data-driven approach led to a reduction in patient readmission rates, improving patient outcomes and healthcare efficiency.
The Two Sides of the Data Coin
Data insights have become a powerful force in the modern world, empowering businesses and organizations to make informed decisions and succeed. However, this power comes with its own set of challenges.
The Transformative Future of Insights
As we generate ever-increasing amounts of data that drive insights, new trends and technologies are emerging to unlock its potential like never before.
Data Insight Analytics Development
Analytics will become increasingly real-time, enabling businesses to make data-driven decisions in the moment. Expect more automation in data analysis tasks. This will free up human analysts. Data analysis tools will become more user-friendly and accessible, empowering more people to leverage data insights. Data Mesh Architecture (cross-domain data analysis) will break down data silos and make it easier to access and integrate data from various sources.
Artificial Intelligence and Machine Learning (AI/ML)
AI and ML will become even more deeply woven into the fabric of insights from data analytics. Their algorithms will excel at identifying complex patterns and relationships in data. Businesses can make more accurate predictions about future trends and customer behavior by leveraging AI data insights. Tedious tasks like data cleaning and preparation will be increasingly automated by AI, freeing up valuable human time.
The Importance of Ethical Data Use
As global insight data becomes more powerful, so does the importance of ethical considerations. Ensuring user privacy and data security will remain paramount. Transparency and user control over data will be critical. Mitigating bias in AI algorithms is essential to avoid discriminatory or unfair outcomes. Developing AI that can explain its reasoning will be crucial for building trust and ensuring responsible data use.
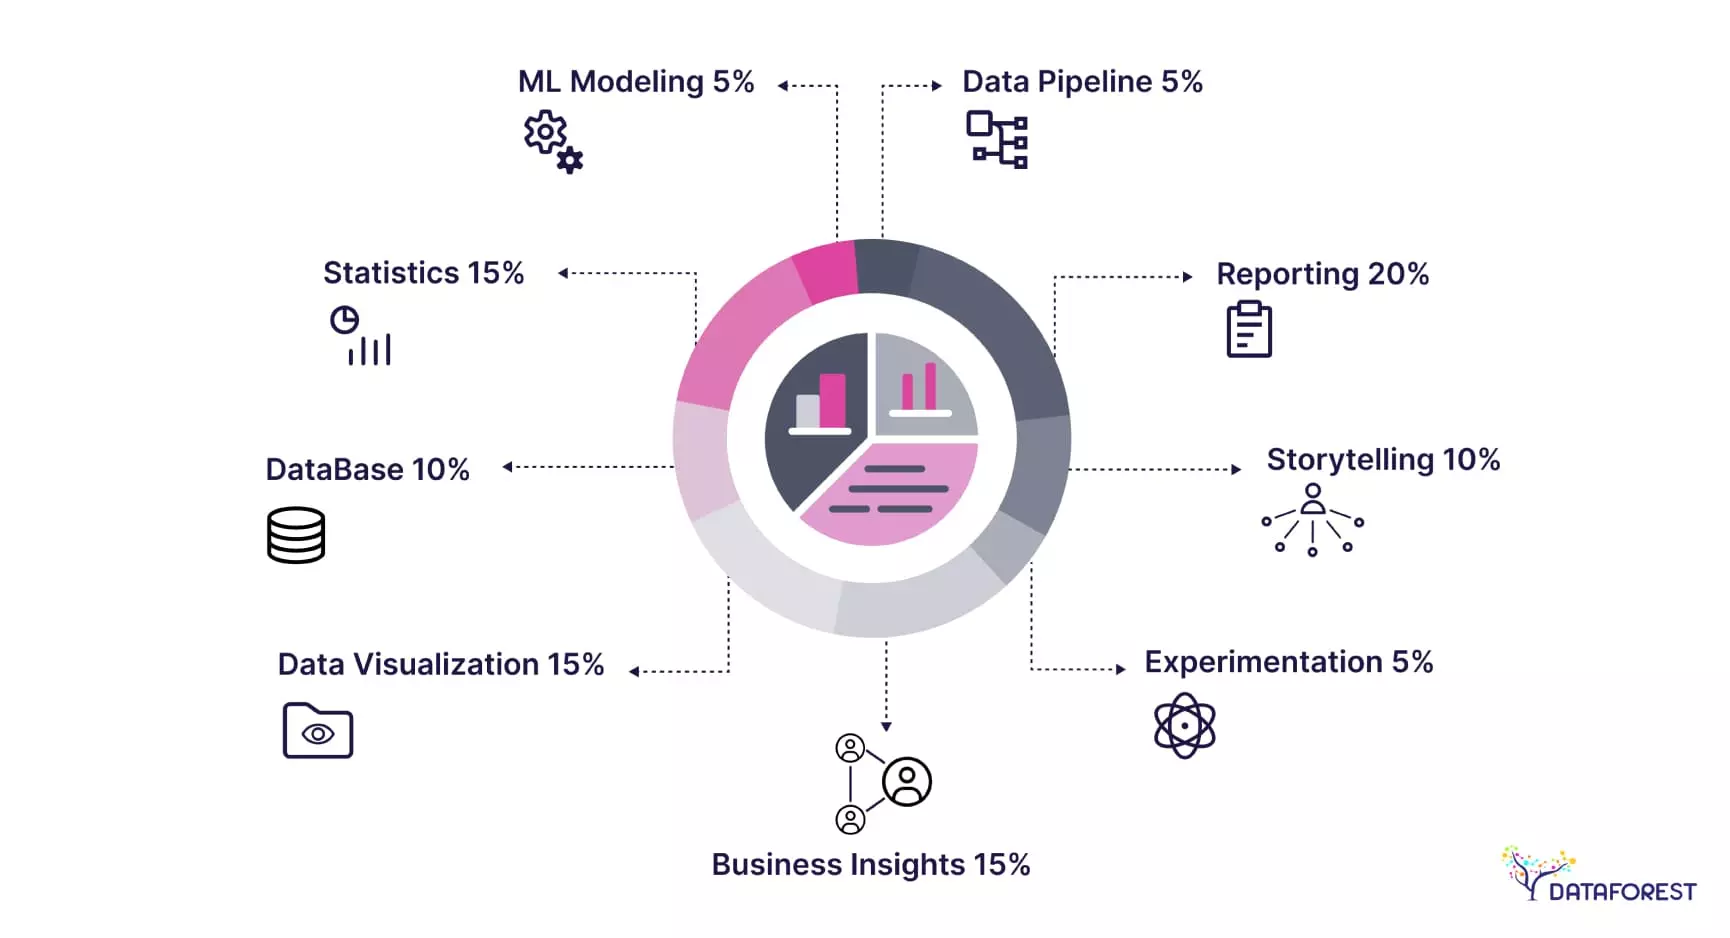
Skills required in data analytics
Taming the Data Beast
Extracting valuable insights from the vast ocean of data is a daunting task. Here's how DATAFOREST helps to address the most significant challenges associated with data insight services:
- Implementation of data quality tools automates data cleansing.
- Providing data insights tools to assess and mitigate bias in data collection and analysis methods.
- Offering various data analytics tools, from business intelligence (BI) dashboards to statistical software.
- Keeping informed about the latest advancements in AI, ML, and other data-related technologies.
Please fill out the form and gain access to a data insight company.
FAQ
What is data insight?
Data insight is the knowledge you gain from analyzing data. It involves uncovering hidden patterns, relationships, and trends within information. These insights empower businesses to make data-driven business decisions and achieve real-world results.
What is an example of a data insight?
An online store might analyze customer purchase data and discover that customers who buy hiking boots also frequently purchase backpacks. This data insight reveals a hidden relationship and suggests the store could promote backpacks alongside hiking boots to boost sales.
Why do we need data insights?
We need data insights to move beyond guesswork and make informed decisions. By analyzing data, we uncover patterns and trends that would otherwise be invisible. These insights help us improve efficiency, target customers more effectively, and gain a competitive advantage.
How do you make data Insights?
Data insights are made through a three-step process. First, you collect data from various sources. Then, you clean and organize the data to ensure its accuracy. Finally, you analyze the data using tools and techniques to identify patterns and trends, revealing valuable insights to guide your decisions.
How are insights from big data different from regular insights?
Big data insights deal with massive datasets, including unstructured formats like text or images. Regular insights focus on smaller, more manageable, and typically well-organized datasets. This difference necessitates advanced tools and techniques to handle big data's sheer volume and variety, revealing broader and more nuanced insights.


%20(1).webp)