In 2026, Business Intelligence has evolved far beyond basic dashboards as a response to the growing need for rapid, data-driven insights in decision-making. While it initially relied on simple spreadsheets and eventually expanded to encompass advanced analytics and sophisticated software that aggregated data, today's landscape is defined by generative AI agents, real-time predictive modeling, and edge computing integration. As businesses face increasingly complex data ecosystems, Business Intelligence tools have adapted to offer deeper, instantaneous strategic understanding.
Business Intelligence — From Insights to the AI Era
Business Intelligence has reached a highly advanced stage of evolution. It's more than just data analysis and reporting. In 2026, it seamlessly incorporates generative artificial intelligence, machine learning, and prescriptive analytics elements to provide businesses with deeper insights and proactive, sometimes autonomous, decision-making capabilities. If you need an individual approach to a solution, book a call.
The Power of Business Intelligence
Business Intelligence (BI) refers to the technology, processes, and tools that enable teams to collect, analyze, and transform raw data into actionable insights. In today's hyper-connected, data-driven business landscape, BI holds immense significance as it empowers companies to make informed decisions based on concrete evidence rather than intuition. BI aids strategic planning, enhances operational efficiency, and helps organizations gain a competitive edge by promptly identifying opportunities and addressing challenges.
The Crucial Role of Data Analysis
Data analysis is pivotal in making informed business decisions by transforming raw data into meaningful insights. It uncovers patterns, trends, and correlations within data, enabling it to understand customer preferences, market dynamics, and operational efficiencies. These insights guide decision-makers in formulating strategies, mitigating risks, and capitalizing on opportunities, ultimately leading to more accurate and successful business choices. DATAFOREST will do the same; you just need to arrange a call.
Shaping Business Intelligence
Business Intelligence (BI) has its roots in the mid-20th century, when companies began using early computer systems to store and retrieve data for basic reporting. However, the concept took shape in the 1980s and 1990s with the emergence of more sophisticated database management systems.
Data warehouses and online analytical processing (OLAP) tools rose in the 2000s, enabling businesses to perform multidimensional analysis and explore data from different angles. The 2010s brought about the integration of data visualization, allowing for a more straightforward interpretation of complex data sets.
Today, in 2026, Business Intelligence has reached a stage where it's not just about historical data analysis but also hyper-personalized predictive analytics, conversational AI interfaces, and real-time automated reporting.
An Overview of Business Intelligence Tools
Business Intelligence tools (BI tools) are software and technologies that gather, analyze, and present data to help businesses make smarter decisions. These tools take raw data from various sources, like cloud databases and IoT sensors, and transform it into easy-to-understand visualizations, reports, and dashboards. BI tools empower teams to uncover insights from data, identify trends, and drive strategic actions for growth.
How BI Tools Simplify Data Transformation
BI tools facilitate data collection, integration, and transformation by streamlining the process of gathering information from various sources. These tools connect to different data repositories, like databases, spreadsheets, and modern cloud data lakes. They then integrate this diverse data into a unified format, eliminating inconsistencies and redundancies.
After integration, BI tools transform the data into a structured and organized state suitable for analysis. It means cleaning up messy data, applying calculations, and enriching it with additional context. This transformed data becomes a reliable foundation for generating reports, visualizations, and dashboards that provide insights into business performance.
Navigating Data Intelligence
These features empower businesses to turn data into actionable insights, fostering informed decision-making and a deeper understanding of their operations and strategies.
- Data Visualization: BI tools use visual elements like charts, graphs, and maps to represent complex data more understandably and engagingly. Data visualization helps users quickly grasp patterns, trends, and relationships within the data.
- Interactive Dashboards: These customizable displays consolidate various visualizations and data summaries in a single view. Users interact with the dashboards, drilling into specific data points or changing parameters to gain deeper insights.
- Ad Hoc Reporting: This feature allows end users to create customized reports without relying on predefined templates. It empowers users to tailor messages to their specific needs, helping them answer specific questions using real-time data.
- Self-Service Analytics: BI tools offer self-service capabilities, enabling non-technical users to explore and analyze data independently using natural language. It reduces the dependency on IT teams and empowers individuals across the organization to make data-driven decisions.

Pillars of Success in Business Intelligence Tools
These components ensure that the data used in BI tools is reliable, well-structured, and accessible:
- Integrating data from various sources is vital as it ensures that information from different departments or systems is combined and analyzed as a unified whole. This integration prevents silos, providing a comprehensive view.
- Data modeling requires structuring data to reflect the relationships between different data points. Effective data modeling supports predictive analytics and forecasting, making it an essential part of BI.
- Data governance establishes guidelines, policies, and procedures for managing data. In Business Intelligence tools, proper data governance ensures that the data used for analysis is accurate, consistent, and compliant with evolving privacy regulations.
The Formation of Different Types of BI Tools
The types of Business Intelligence Tools emerged based on varying functionalities and capabilities required to analyze, visualize, and interpret data in different ways to suit diverse business needs.
Categories of Business Intelligence Tools
Each category serves a specific purpose within the BI landscape, contributing to a comprehensive toolkit.
- Data Mining Tools: Data mining tools extract valuable patterns and knowledge from large datasets. They identify hidden relationships and correlations, helping businesses discover valuable insights that might not be apparent through traditional analysis.
- Business Intelligence and Reporting Tools: These tools focus on creating structured reports that present data in a tabular format. They summarize information and generate regular reports, often with charts and graphs. Business Intelligence reporting tools are valuable for sharing insights across organizations and maintaining a consistent data view.
- Data Visualization Tools: Visualizing tools turn complex data into easy-to-understand visuals like charts, graphs, and maps. They help uncover patterns, trends, and relationships in the data that might take time to appear in raw numbers.
- Self-Service BI Platforms: Self-service BI tools empower non-technical users to analyze their data without relying on IT teams. They provide user-friendly interfaces for data exploration, querying, and creating reports or dashboards.
- OLAP (Online Analytical Processing) Tools: OLAP tools specialize in multidimensional analysis, allowing users to explore data from various hierarchies. They provide interactive and dynamic capabilities for drilling down, slicing, dicing, and pivoting data.
- Predictive Analytics Tools: Predictive Business Intelligence and analytics tools go beyond historical data analysis by using statistical algorithms and machine learning techniques to forecast future trends and outcomes.
BI Tools: Exploring Functions
Each type of BI tool offers unique functionalities and serves specific use cases, contributing to a comprehensive toolkit for extracting insights from data.
Cloud-Based BI Tools: Power BI, Tableau Cloud, and ThoughtSpot
Here are three of the most popular cloud-based tools of Business Intelligence in 2026, along with their advantages in terms of scalability and AI functionality for accessibility:
- Microsoft Power BI is a cloud-based platform that enables users to connect to various data sources, create interactive reports, and share insights.
- Power BI is built on Azure, Microsoft's cloud platform, which ensures robust scalability. It can handle massive datasets and accommodate increasing user demands.
- Power BI integrates seamlessly with Microsoft products like Excel, SharePoint, and Dynamics 365. This integration streamlines data workflows.
- Power BI's "Copilot" AI feature allows users to ask questions in plain language, generate code, and receive instantly visualized answers, making data exploration highly intuitive.
- Power BI is built on Azure, Microsoft's cloud platform, which ensures robust scalability. It can handle massive datasets and accommodate increasing user demands.
- Tableau Cloud is the fully hosted, cloud-native version of the popular Tableau BI tool. It enables users to create interactive visualizations, dashboards, and reports to gain analytics and insights.
- Tableau Cloud is designed to handle large datasets and accommodate varying user activity levels. It scales automatically to meet growing data demands.
- Tableau Cloud supports real-time collaboration, enabling teams to work on the same visualizations and share insights simultaneously from anywhere.
- Backed by Salesforce's Einstein AI, its intuitive interface and drag-and-drop functionality make complex statistical analysis accessible to users with varying technical backgrounds.
- Tableau Cloud is designed to handle large datasets and accommodate varying user activity levels. It scales automatically to meet growing data demands.
- ThoughtSpot is an AI-powered analytics platform that saw massive adoption between 2025 and 2026, focusing heavily on search and generative AI for data exploration.
- Being cloud-native, it handles large-scale data processing directly in cloud data warehouses (like Snowflake or BigQuery) without needing to move the data.
- ThoughtSpot allows users to literally search their data like they would use a search engine, automatically generating accurate charts and dashboards on the fly.
- It supports embedding these AI-generated dashboards and reports into other applications, websites, or portals, creating a seamless data experience for end-users.
- Being cloud-native, it handles large-scale data processing directly in cloud data warehouses (like Snowflake or BigQuery) without needing to move the data.
Factors Guiding the Choice of Business Intelligence Tools
Critical considerations for choosing BI tools are based on a team’s needs, data complexity, user expertise, scalability features, and desired functionalities.
The Selection Process: Key Factors for Choosing Effective Business Intelligence Tools
When selecting BI tools for your business, several important factors come into play:
- Business Goals: Are you aiming for better sales, Natural Language Processing (NLP), operational efficiency, or market insights? Align the BI tool's features with your business goals.
- Data Complexity: Evaluate the complexity of your data. If you deal with large, varied datasets, you'll need a tool that handles intricate data structures and performs complex analysis.
- Technical Expertise: Some tools are more user-friendly and require minimal technical knowledge, while others require advanced skills for setup and usage.
- Scalability: Think about the future growth of your data and user base. Choose a tool that scales to accommodate increased data volume and usage without compromising performance.
- Required Features: Assess the functionalities you require. Do you need advanced visualization, predictive analytics, or real-time reporting? Ensure the tool fulfills your specific needs.
- Integration: Check if the BI tool integrates seamlessly with your existing systems, databases, and web applications. Integration eases data flow and minimizes disruptions.
- Accessibility: Consider the tool's accessibility across devices. Cloud-based solutions offer remote access, while mobile compatibility ensures insights on the go.
- Cost: Evaluate the total cost of ownership: licensing fees, training, implementation, and ongoing maintenance. Find a solution that offers value for your budget.
- Vendor Reputation: Research the vendor's reputation for customer support and updates. Reliable support ensures smooth operation and timely issue resolution.
- Security: Data security is paramount. Ensure the tool follows industry standards and offers features like encryption and role-based access controls.
- Customization: Look for a tool that allows customization to match your branding and data requirements. Generic solutions might not cater to your specific needs.
- Usability: Consider how user-friendly the tool is. If it's intuitive and easy to use, your team is more likely to adopt it effectively.

Sustaining Growth: Exploring Scalability and Compatibility in Business Intelligence Tools
When a BI tool is scalable, it increases data volumes without slowing down or causing disruptions.
- Scalability: It refers to a BI tool's ability to handle growing data volumes, increased user demands, and changing business needs. Scalable BI tools can accommodate expanding data without compromising performance. As your organization accumulates more data or experiences higher user engagement, a scalable tool ensures that data analytics and reporting processes remain efficient and responsive.
- Compatibility with Existing Systems: It asks how well a BI tool integrates with your organization's systems, databases, and applications. An ideal BI tool seamlessly connects with your current technology stack, allowing data to flow smoothly between different systems. This integration streamlines data processes, prevents data silos, and ensures that insights are derived from accurate, up-to-date information. Compatibility with existing systems ensures the tool works harmoniously within your technology ecosystem, reducing friction and enhancing the overall data analytics experience.
An Overview of Pricing and Licensing Models for BI Tools
- Upfront Costs: Many BI tools have upfront costs, which include licensing fees, installation, and setup. This initial investment covers the software and any required infrastructure.
- Subscription Models: These require a regular fee to access the BI tool, typically every month. They often include updates, maintenance, and customer support.
- User-Based Pricing: Some tools charge based on the number of users accessing and using the BI platform. This pricing structure varies depending on the level of access.
- Tiered Pricing: Offers different levels of functionality at various price points. Users choose a tier that aligns with their needs.
- Consumption-Based Models: Charge based on usage: the amount of data processed or the number of queries executed. This model is suitable for teams with fluctuating data needs.
- Freemium/Open-Source: Some free BI tools offer versions with limited features, or open-source tools can be customized. These options are cost-effective for small businesses.
- Enterprise Pricing: Larger enterprises with unique needs might negotiate custom pricing with BI vendors. It is based on data volume, integration complexity, and additional services.
- Hidden Costs: Consider potential additional costs such as training, implementation, consulting, and support services. These costs impact the total cost of ownership.
- Cloud Infrastructure: Cloud-based BI tools have pricing models that involve paying for the resources used in the cloud infrastructure: storage, processing power, and transfer.
Navigating User-Friendly Implementation of Business Intelligence Tools
When selecting Business Intelligence software tools, prioritize those with intuitive user interfaces, conversational AI features, and drag-and-drop functionalities, making exploration and visualization accessible to all users. Look for agencies offering pre-built templates and self-service capabilities to facilitate quick insights creation without extensive technical skills. Also, ensure the availability of comprehensive training resources and responsive customer support to streamline implementation and promote user adoption.
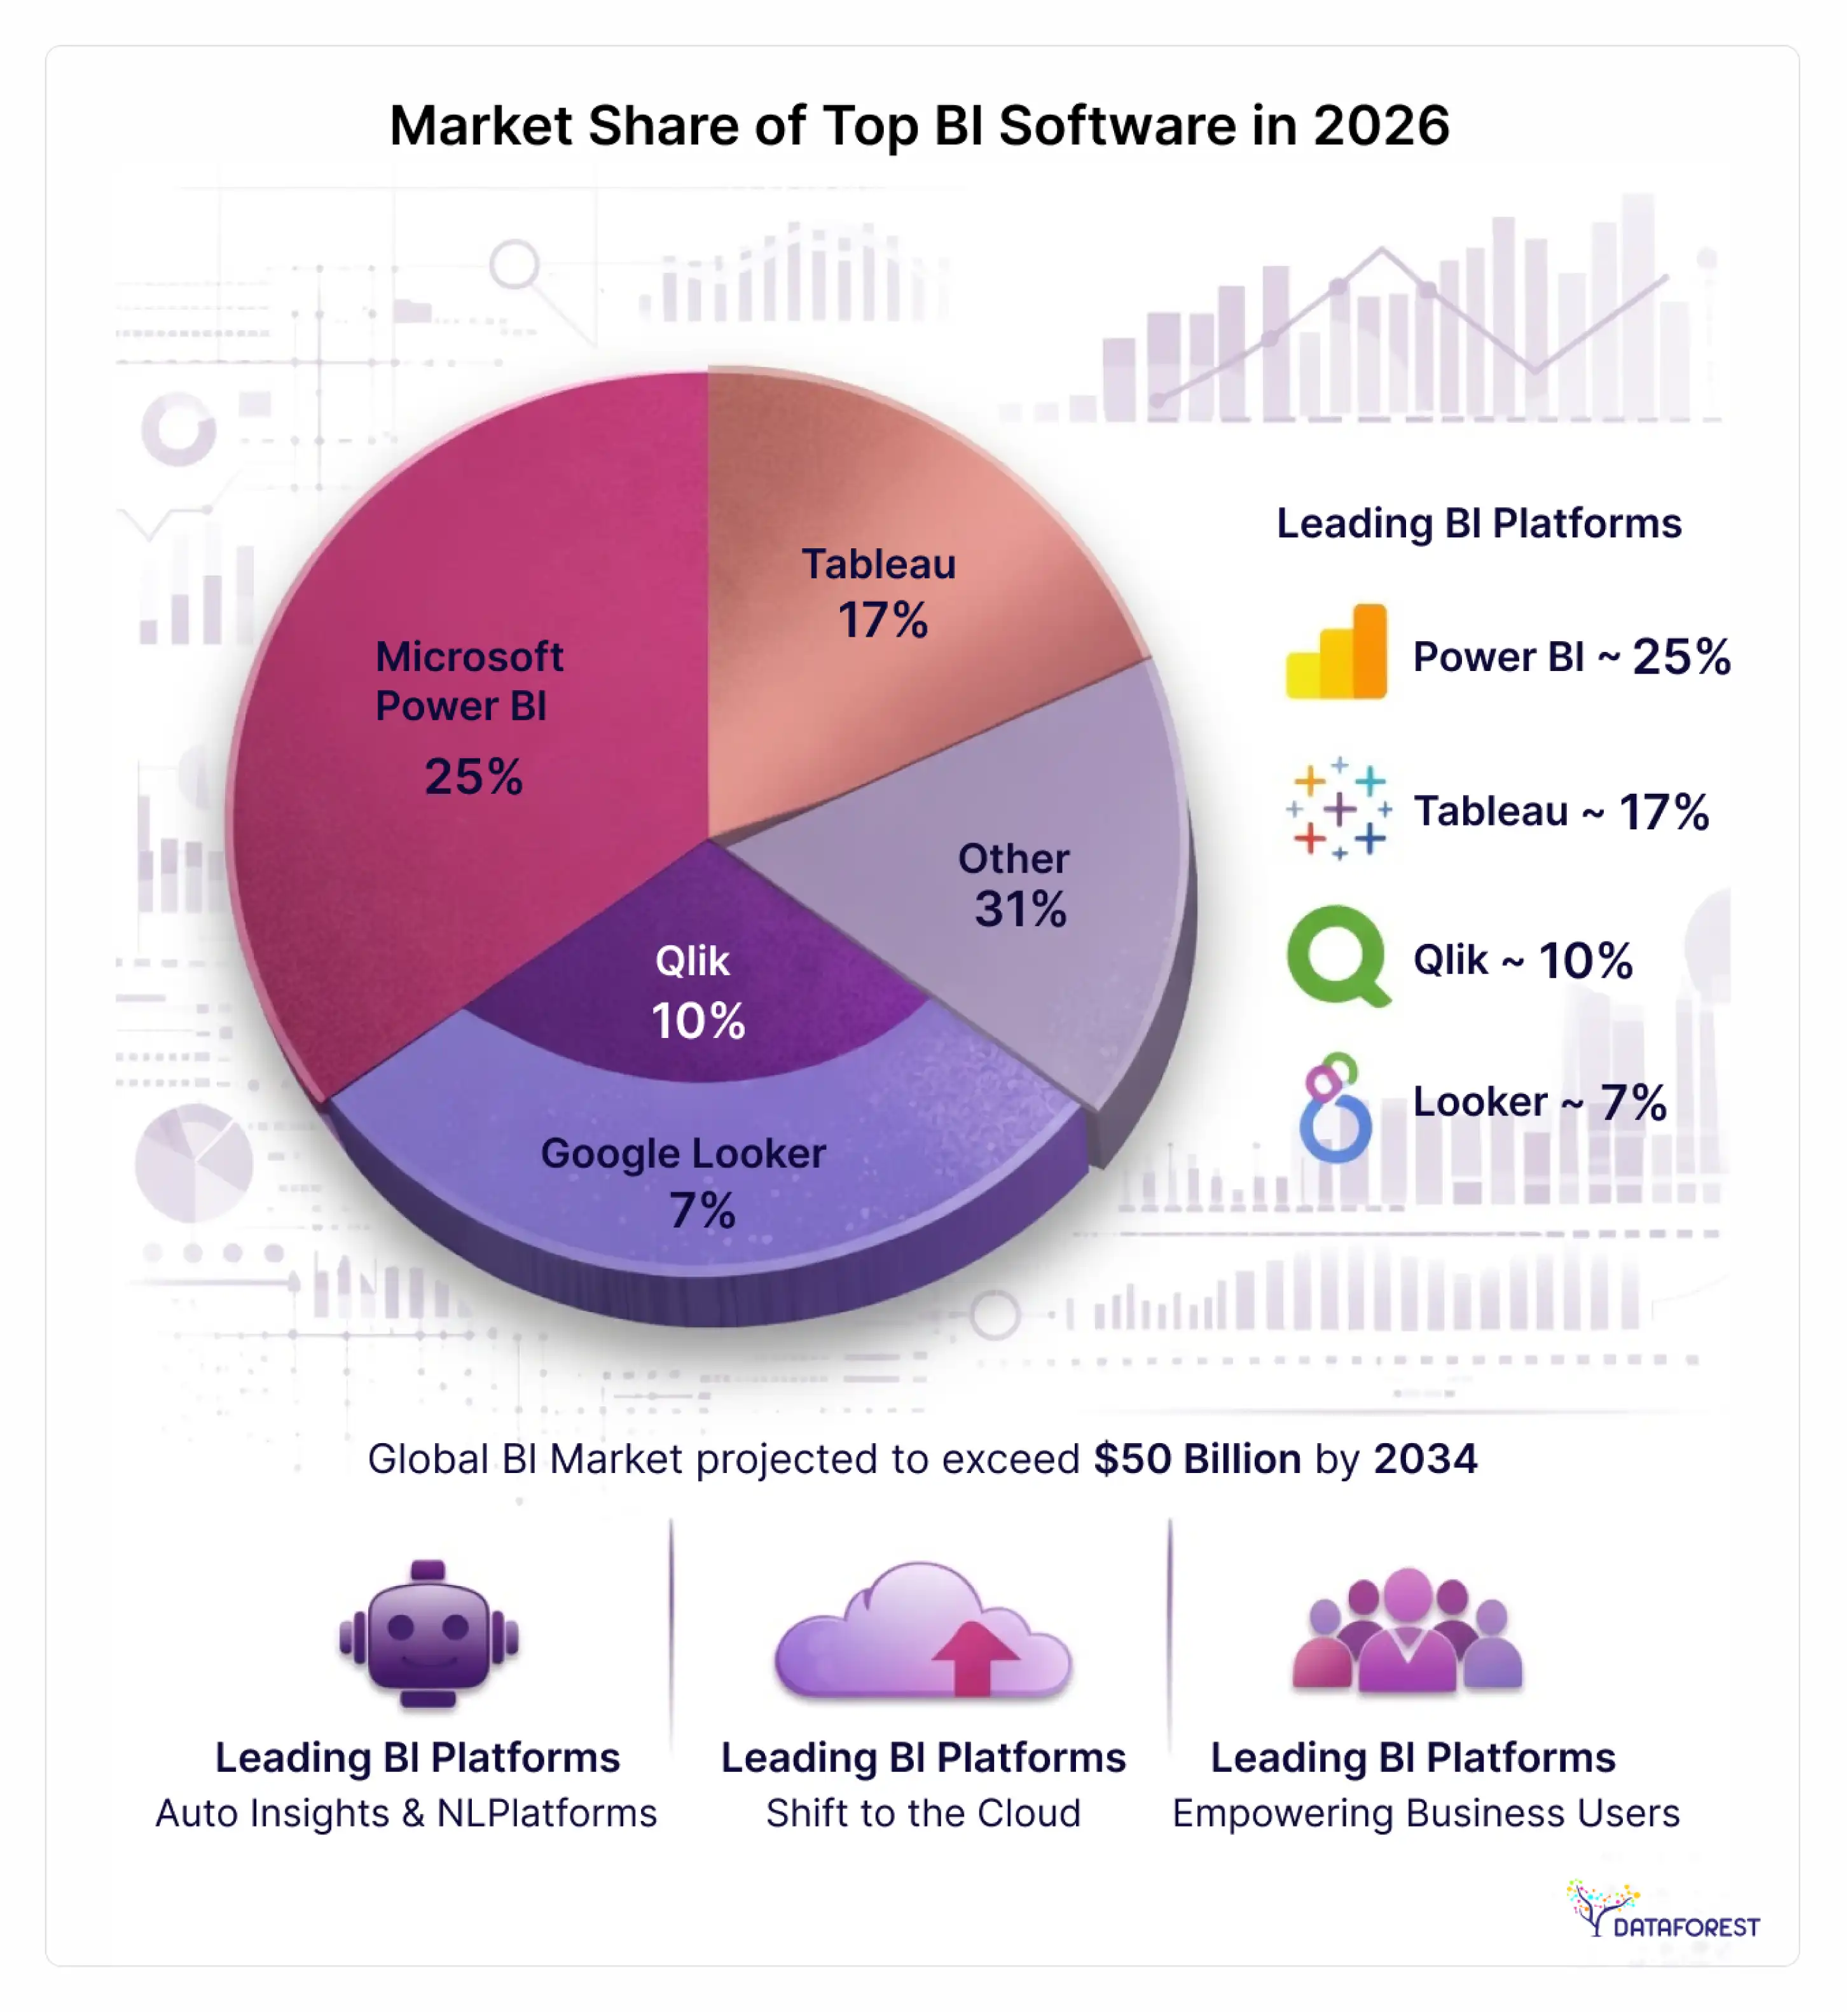
Popular Business Intelligence Tools Shaping Insights in 2026
These tools offer a range of features and functionalities to cater to diverse business needs and analytics requirements, reflecting the current market leaders and rapidly growing platforms:
- Power BI by Microsoft
- Tableau by Salesforce
- Looker by Google Cloud
- ThoughtSpot
- Qlik Sense by Qlik
- Metabase
- MicroStrategy
- Sisense
- Domo
- IBM Cognos Analytics
If you want to learn more about top tools, then please read our blog.

Mastering the Craft: Analysis with Business Intelligence Tools
Analyzing data with tools for Business Intelligence transforms raw numbers into meaningful insights through advanced analytics techniques, visualizations, and strategic interpretation.
A Step-by-Step Guide to Analyzing Data with Business Intelligence Tools
Throughout this process, BI tools facilitate each step, making analysis more efficient and enabling organizations to extract actionable insights from their data.
- Data Collection
- Integration
- Transformation
- Modeling
- Exploratory Analysis
- Querying and Filtering
- Creating Dashboards
- Data Visualization
- Statistical Analysis
- Predictive Analytics
- Interpretation
- Sharing Insights
A Comprehensive Journey of Exploration, Visualization, and Interpretation with BI Tools
Business Intelligence tools are vital in streamlining exploration, enabling dynamic visualization, and facilitating meaningful interpretation.
Best Practices for Effective Analysis with Business Intelligence Tools
These practices with Business Intelligence tools were gathered through years of industry experience, iterative learning, and collaboration among data analysts, experts, and teams working together.
Business Intelligence Tools' Impact on Data Analysis
By adhering to these best practices, companies harness the full potential of Business Intelligence tools.
- Defining clear objectives ensures that exploration is aligned with business goals.
- Cleaning and validating data minimizes errors and ensures accurate insights.
- Preliminary exploration uncovers trends and outliers, informing subsequent analysis.
- Using appropriate visualizations enhances the understanding and communication of insights.
- Interpreting within the relevant business context ensures meaningful insights.
- Cross-checking insights against business knowledge validates findings.
- Iterative analysis refines models, hypotheses, and insights through learning.
- Engaging diverse teams fosters varied perspectives, improving the accuracy of insights.
- Documenting assumptions maintains transparency and facilitates future reference.
- Regularly refreshing data and analyses keeps insights current and relevant.
- Collecting feedback from stakeholders refines analyses and addresses business needs.

Cornerstones of Reliable Insights in Business Intelligence and Analysis
They ensure that the info used for analysis is trustworthy, reliable, and aligned with business needs.
Data Quality
- Ensuring data is free from errors, inconsistencies, and inaccuracies, which can lead to incorrect insights.
- Verifying that data is comprehensive and includes all necessary information, avoiding gaps in analysis.
- Maintaining uniform formats, units, and conventions across datasets to prevent conflicting interpretations.
- Assessing data's relevance to the analysis goals, eliminating unnecessary or outdated information.
- Using real-time or up-to-date data ensures that insights are relevant and reflect the current state.
Data Governance
- Defining who is responsible for accuracy, security, and integrity within the team.
- Creating guidelines for data usage, access, and sharing to maintain consistency and security.
- Documenting sources, transformations, and methodologies to ensure transparency.
- Implementing measures to protect sensitive data and adhere to 2026 regulatory compliance standards.
- Regularly reviewing and auditing data to detect anomalies and maintain quality.
- Ensuring that privacy regulations strictly handle personal or sensitive data.
Visualization Techniques for Actionable Business Intelligence
Effective use of these techniques empowers companies to present complex data in an accessible and understandable format, fostering informed decision-making and insights.
- Bar Charts and Column Charts
- Line Charts
- Pie Charts and Donut Charts
- Scatter Plots
- Heatmaps
- Area Charts
- Histograms
- Tree maps
- Bubble Charts
- Gauges and KPIs
- Funnel Charts
- Geographic Maps
- Box Plots
- Waterfall Charts
- Word Clouds
[Image showcasing different data visualization techniques like heatmaps, scatter plots, and waterfall charts]
Regular Maintenance and Updates in Business Intelligence
Regular maintenance and updates are crucial to ensure the accuracy, reliability, and relevance of insights derived from Business Intelligence tools. Keeping data up-to-date prevents outdated information from influencing AI models or human decisions, maintains the integrity of analysis, and reflects real-time business conditions, ultimately enhancing the effectiveness of strategic planning and operational efficiency.
Formation of Use Cases for Business Intelligence Tools Across Industries
Real-life use cases for Business Intelligence tools were formed through practical applications across diverse industries, leveraging analysis to drive informed decisions, uncover hidden insights, and enhance operational efficiencies.
Examples of Business Intelligence Tools Implementations
These real-life examples demonstrate how Business Intelligence tools are pivotal in various industries today.
- Retail Industry: A retail chain uses BI tools to analyze sales trends and customer preferences in real-time. They optimized stock replenishment, reducing overstocking and stockouts, ultimately enhancing customer satisfaction and operational efficiency by tracking inventory levels and predictive demand patterns.
- Healthcare: A hospital implemented BI tools to analyze data, including treatment outcomes and wait times. It enabled them to identify bottlenecks in patient flow, allocate resources effectively, and improve overall patient care by reducing waiting times and streamlining processes using AI-assisted scheduling.
- Finance: A financial institution employed Business Intelligence tools to monitor transaction data for unusual patterns. By detecting anomalies in real-time using machine learning, they successfully identified fraudulent activities, prevented financial losses, and ensured the security of accounts.
- Manufacturing: A manufacturing company utilized BI tools to analyze its supply chain data, including production rates and supplier performance. It allowed them to identify inefficiencies, optimize production schedules, and negotiate better terms with suppliers, leading to cost savings and improved production timelines.
- E-commerce: An e-commerce platform uses BI tools to analyze customer behavior, including browsing history and purchase patterns. It tailored highly personalized Marketing campaigns, recommended relevant products dynamically, and enhanced customer engagement, increasing sales and customer loyalty.
Strategic Data Empowerment with Business Intelligence Tools
Here's how businesses use Business Intelligence tools to gain a competitive advantage:
- Retailers used BI tools to analyze customer purchasing behaviors and preferences. By identifying trends and segmenting customer groups, they personalized marketing campaigns, increasing conversion rates and customer loyalty.
- In the financial sector, BI tools helped institutions analyze vast amounts of data to assess risk factors. They made informed investment decisions and minimized losses by detecting potential threats and predicting market trends.
- Manufacturers utilize BI tools to monitor production processes and equipment performance. They optimized production schedules, reduced downtime, and achieved higher output with lower operational costs by identifying bottlenecks.
- Hospitals and clinics employ BI tools to track patient outcomes and treatment effectiveness. They refined treatment protocols, improved patient care, and established themselves as leaders in quality healthcare.
- E-commerce businesses use BI tools to analyze sales patterns and inventory levels. It allowed them to optimize stock levels, avoid excess inventory costs, and fulfill orders more efficiently, enhancing customer satisfaction and repeat business.
The Transformative Impact of Business Intelligence Tools Adoption
Adopting Business Intelligence tools yields transformative benefits, including data-driven decision-making for precise strategic planning, streamlined operational efficiency through optimized processes, and improved customer experiences with personalized insights, culminating in a distinct competitive advantage across industries. Understanding the importance of data analytics is key.
Anticipating Future Trends in Business Intelligence Tools
The defining trends in Business Intelligence tools for 2026 involve the deep integration of AI and Agentic workflows for predictive analytics, seamless cross-platform and edge computing accessibility, and advanced natural language processing capabilities for conversational, intuitive interactions.
Emerging Trends and Innovations in the Business Intelligence Landscape
- BI tools now natively incorporate Generative AI and machine learning to provide not just predictive but also prescriptive analytics, enabling businesses to anticipate trends and automate strategic actions.
- Augmented analytics combines AI, machine learning, and Large Language Models (LLMs) to provide automated, narrative-driven insights, drastically reducing the need for manual analysis.
- Businesses are focusing on making data accessible to a broader range of users. Self-service BI tools now function like conversational assistants, allowing any user to generate complex reports simply by asking a question.
- Cloud-based and Edge BI solutions dominate due to their scalability. They allow companies to process data closer to the source (IoT devices) while analyzing massive datasets in the cloud.
- As data privacy regulations become more stringent globally, BI tools incorporate automated, robust data governance and security features to ensure compliance and protect sensitive information dynamically.
- The Internet of Things (IoT) generates massive amounts of real-time data. BI tools have evolved to handle high-velocity IoT data, allowing businesses to extract instant insights from connected devices and sensors.
- BI tools focus on data storytelling, presenting data in a narrative format and allowing users to tell a cohesive story with their insights, making it easier to drive executive action.
- With the complete reliance on mobile ecosystems, BI tools are heavily mobile-optimized, empowering users with push-notification insights and interactive reports on the go.
- Teams work with complex hybrid data ecosystems. BI tools adapt to seamlessly support both on-premises and multi-cloud architecture data sources for unified analysis.
Advancements in AI, NLP, and Augmented Analytics
These advancements have moved beyond enhancing capabilities—they have completely democratized data-driven decision-making in 2026.
- AI-powered Analytics: AI-driven advancements have transformed data analysis. Machine learning algorithms analyze historical data to predict future outcomes and automate anomaly detection, identifying deviations from expected patterns and instantly alerting stakeholders to potential issues before they escalate.
- Natural Language Processing (NLP): Modern NLP empowers users to interact with BI tools using everyday language. Conversational interfaces act as "Data Copilots," allowing users to ask complex questions and receive instantly generated dashboards as responses. It removes the technical barrier to data access.
- Augmented Analytics: This merges AI and data analytics to fully automate the process of data preparation, insight generation, and storytelling. BI tools now sift through massive datasets to identify relevant patterns, generate automated insights, and build the most effective visualizations with zero manual effort required, radically automating data workflows.
Envisioning the Impact of AI, NLP, and Augmented Analytics on Data Analysis
The convergence of Generative AI, natural language processing, and augmented analytics has revolutionized data analysis in 2026. These established technologies allow for instant insight extraction through conversational interfaces, highly accurate predictive modeling for strategic planning, and streamlined decision-making by automating tedious data preparation tasks, ultimately propelling teams toward highly agile, automated, and informed business strategies through streamlined data analytics.
Experienced Data Engineering Company Makes Business Decisions
A data engineering company with broad BI experience in the AI era, such as DATAFOREST, empowers businesses by seamlessly integrating diverse data sources, designing optimized cloud data warehousing, and using advanced AI algorithms to extract actionable insights. We tailor interactive dashboards and predictive models to modern business needs while ensuring strict data governance and security compliance. This Data Engineering expertise qualifies businesses to navigate the complex data landscapes of 2026 and make smarter, faster decisions using the full power of modern Business Intelligence tools and robust data science services.
If you are ready to test the effectiveness of your business and step into the future of data, then please book a call, and let's get started with a consultation.
FAQ
What are business intelligence tools?
Business Intelligence tools are software applications and platforms designed to gather, process, analyze, and visualize data, enabling organizations to extract meaningful insights and make informed decisions. Picture a user-friendly, often AI-assisted interface for querying databases, creating reports, generating charts, and presenting data efficiently. They empower businesses to transform raw data into actionable intelligence.
How do business intelligence tools differ from traditional data analysis methods?
Business Intelligence tools differ from traditional manual data analysis by offering automated, interactive, real-time, and highly visual approaches that enable much faster insights extraction and informed decision-making from highly complex and large-scale datasets.
How do self-service BI platforms empower non-technical users to perform data analysis?
Self-service BI platforms empower non-technical users by providing intuitive interfaces, conversational AI (asking questions in plain text), drag-and-drop functionalities, and pre-built templates. This allows them to independently access, explore, and analyze data without needing specialized coding or Data Science skills.
Can Business Intelligence tools handle large volumes of data from various sources?
Yes. Modern Business Intelligence tools are built natively for the cloud and are designed to handle massive volumes of data. They offer data integration, cleansing, and transformation capabilities, consolidating data from diverse sources like data lakes, cloud warehouses, SaaS platforms, cloud platforms, and IoT sensors.
Can business intelligence tools help organizations uncover hidden patterns and trends in data?
Absolutely. Through advanced analytics techniques, machine learning algorithms, and exploratory data visualization, these tools can instantly reveal correlations, anomalies, and hidden trends that are impossible to spot manually, enabling a much deeper understanding.
How do business intelligence tools enable data-driven decision-making at different levels of an organization?
BI tools enable decision-making across all levels by providing tailored insights. Executives can access high-level AI-summarized key performance indicators (KPIs) for strategic planning; managers can drill into detailed operational reports; and front-line employees can access real-time dashboards for immediate, day-to-day tactical decisions involving big data.


%20(1).webp)