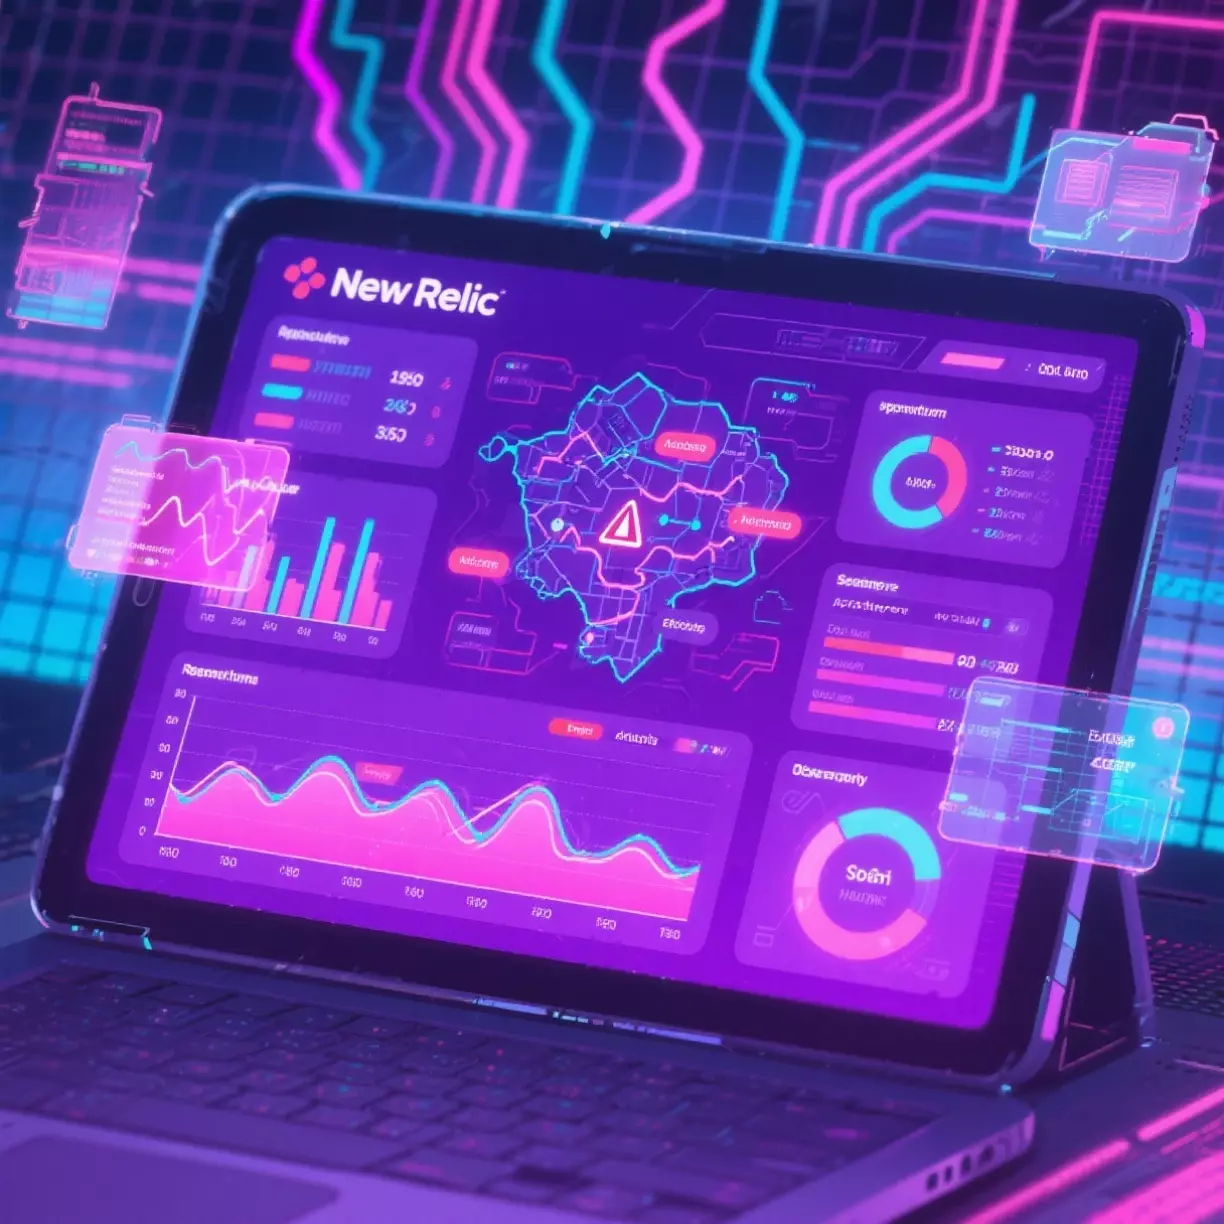
New Relic is a software analytics and performance monitoring platform designed to provide real-time insights into application and infrastructure performance, system behavior, and user interactions. Primarily employed within DevOps and IT operations, it enables organizations to monitor and analyze complex digital ecosystems by gathering, visualizing, and interpreting data on the performance of applications, servers, and cloud environments. This observability facilitates proactive identification of system bottlenecks, error diagnostics, and system optimization, enhancing both operational efficiency and end-user experience.
Core Characteristics
- Telemetry and Instrumentation:
New Relic collects detailed telemetry data from multiple sources, encompassing metrics, events, logs, and traces (collectively referred to as MELT data) from various parts of the application and infrastructure. This data is gathered by embedding New Relic agents within applications and infrastructure components, which then report on a range of performance indicators, such as response time, throughput, error rates, and database query performance.
- Full-Stack Observability:
The platform provides a comprehensive view of the entire stack, spanning from backend services and databases to frontend components and user interactions. This full-stack perspective enables teams to trace the flow of requests and interactions through each layer, identifying how each component affects overall system performance.
- Distributed Tracing:
Distributed tracing is integral to New Relic's approach, particularly in microservices architectures. It allows teams to trace individual requests as they propagate through multiple services and dependencies, identifying latency, errors, and service bottlenecks. By examining the sequence of service calls within a transaction, developers can quickly pinpoint problematic services or code sections.
- Real-Time Dashboards and Alerts:
New Relic features customizable, real-time dashboards that display telemetry data and performance metrics for diverse stakeholders, including developers, operations, and business analysts. These dashboards allow for real-time monitoring, enabling immediate response to performance degradation. Additionally, the platform’s alerting system can be configured to notify teams of predefined thresholds for various metrics, facilitating proactive response to potential issues before they impact users.
- AI-Powered Anomaly Detection:
New Relic incorporates AI-driven anomaly detection to identify unusual system behavior. By using machine learning algorithms, it establishes baselines for normal performance and generates alerts when anomalies, such as unusual spikes in CPU usage or latency, deviate from expected norms. This functionality enhances New Relic's ability to flag potential issues automatically and recommend preventive actions.
Functions and Key Components
- APM (Application Performance Monitoring):
APM is central to New Relic's functionality, offering insights into application health, code performance, and error rates. By examining details like request response time, database queries, and external service interactions, APM assists in isolating performance bottlenecks and optimizing code efficiency.
- Infrastructure Monitoring:
Infrastructure monitoring allows users to observe the health and performance of servers, cloud services, and containers. It includes monitoring for CPU usage, memory, disk I/O, and network metrics. This aspect of New Relic is particularly useful for cloud-native environments where resource allocation and scalability are paramount.
- Synthetic Monitoring:
Synthetic monitoring involves simulated user transactions, where New Relic runs scripts to mimic user interactions with an application to test its availability, performance, and response times. This component provides insights into user experience without relying on actual user activity, allowing teams to preemptively address issues that could affect end users.
- Error Tracking and Analysis:
New Relic’s error tracking feature identifies and classifies errors across the application stack. It provides details on the error type, stack trace, and impacted transactions, enabling developers to trace back the source of exceptions and fix issues efficiently.
- Log Management:
Log management integrates with other observability data, allowing teams to correlate logs with metrics and traces. New Relic enables log aggregation, indexing, and searching, giving users a comprehensive view of application and infrastructure logs, useful for root-cause analysis and debugging.
- Service Maps:
Service maps visualize dependencies between services, databases, and external APIs within an application ecosystem. This topological map shows how services interact and supports impact analysis when a particular service or dependency experiences an issue, assisting in troubleshooting and impact assessment.
New Relic is widely utilized in complex, large-scale applications, particularly those involving distributed architectures, such as microservices or serverless applications. It is a valuable tool for DevOps teams, SREs (Site Reliability Engineers), and software engineers who need to ensure application reliability, optimize performance, and improve user experience. By providing in-depth visibility into how each service and infrastructure component functions, New Relic aids in the continuous delivery and deployment processes, supports real-time performance monitoring, and enables quick response to incidents, contributing to higher application uptime and stability.


.webp)
.webp)


