Diagnostic analytics found that Amazon's size charts lied to customers, causing 23% of returns. They adjusted the charts and reduced returns by $2 billion without altering the products. We can consider your case; please schedule a call to discuss further.
The Four Main Types of Analytics
Medium shows that the four types of analytics work across timeframes—what happened, why, what might happen, and what next—and teaches you to match the right question with the correct method. Each of the types of analytics works on a different clock: past, cause, forecast, or decision. The split is timing, but the shared fuel is fear of getting caught off guard. Companies use them to help individuals make clearer choices.
What Happened to Your Business Last Quarter?
Descriptive analytics, the first of the four types of analytics, shows you the mess after it happens. Companies use it to determine where money was spent and why customers left. The truth is simple: you can't fix problems you can't see.
What It Does and Why It Matters
Descriptive analytics tells you what broke in your business after it broke. Sales dropped 15% in March, customer complaints doubled, or inventory ran out faster than expected. This may sound basic, but most managers make decisions based on hunches rather than facts. The benefit is control over chaos— you stop guessing about problems that cost money. However, knowing what happened doesn't tell you why it happened or how to prevent it next time.
Real Company Problems It Solves
- Retail chains track which stores lose money and which products sit on shelves gathering dust.
- Banks monitor loan defaults by region to spot trouble before it spreads to other areas.
- Manufacturing plants identify machines that break down most often to schedule maintenance.
- Healthcare systems analyze patient wait times to reduce complaints and improve care quality.
Every use case follows the same pattern: take business chaos and turn it into precise numbers that executives can understand without translation. That’s the foundational role of the types of analytics.
How It Works and Where It Fails
Descriptive analytics pulls data from multiple sources and creates reports, dashboards, and visualizations that show trends. The tools range from Excel spreadsheets to enterprise platforms like Tableau or Power BI. Companies start here because the technology is mature and the necessary skills are available in-house. The limitation is timing—you learn about problems weeks or months after they started hurting revenue. Another constraint is scope—it shows symptoms but rarely reveals root causes, so teams fix surface issues while deeper problems continue bleeding money.
Why Did Your Revenue Drop Last Quarter?
Diagnostic analytics, another of the types of data analytics, digs into problems after descriptive analytics finds them. Companies use it when dashboards show bad numbers, but nobody knows why. This is where businesses distinguish between symptoms and real causes.
What Problems It Solves and Why Companies Pay for It
Diagnostic analytics answers the question that keeps executives awake: why did this happen? Sales reports indicate a drop in revenue, but a diagnostic analysis reveals that shipping delays led to customer defections. Website traffic fell, but the real culprit was a search algorithm change that buried product pages. Companies pay for this because symptoms lie and waste money on wrong fixes. The benefit is precision—teams stop throwing solutions at walls, hoping something sticks. However, finding root causes takes time, and some problems have multiple interconnected causes that resist simple explanations.
When Enterprises Use This Analysis
- E-commerce sites drill into cart abandonment data to find checkout process flaws.
- Manufacturing firms investigate control failures to prevent product recalls and ensure the safety of products.
- Financial services analyze loan default patterns to understand which underwriting criteria failed.
- Telecommunications providers examine network outage data to identify infrastructure weak points.
- Marketing teams dissect campaign performance to learn why some ads convert and others burn budget without results.
Which Tools Work and What Breaks Them
Diagnostic analytics requires correlation analysis, root cause analysis frameworks, and statistical techniques like regression analysis. Tools include specialized platforms like SAS, R, Python libraries, and business intelligence systems with advanced analytics capabilities. Companies struggle with data quality—garbage data produces garbage insights. Another limitation is human bias—analysts often find causes that confirm existing beliefs rather than challenge assumptions.
AI Forecasting That Saved $142M for Global Retailer


I think what is really special about the DATAFOREST service is its flexibility, openness, and level of quality and expertise.
Time pressure also disrupts the process because a thorough diagnosis can take weeks, while executives want answers in days.
What Will Hurt Your Business Next Quarter?
Predictive analytics, one of the most critical types of analytics, names future problems before they destroy revenue. Teams use it to avoid disasters they can see coming. The catch is simple: predictions work until they don't.
What Future Control Gets You and What It Costs?
Predictive analytics forecasts problems weeks or months before they hit your business.
- Customer churn models identify which clients will cancel subscriptions next quarter.
- Demand forecasting prevents inventory shortages during peak sales periods.
- Equipment failure predictions schedule maintenance before machines break down and halt production.
The benefit is preparation time—teams fix problems before customers notice them. The cost is complexity and false confidence because models fail when market conditions change faster than patterns suggest.
Where Companies Bet Money on Predictions
- Retailers predict seasonal demand to avoid overstocking warehouses with products nobody wants.
- Insurance companies forecast claim volumes to set premium rates that cover payouts.
- Airlines predict passenger demand to optimize flight schedules and pricing strategies.
- Banks build credit risk models to approve loans for customers who will actually pay them back.
- Healthcare systems predict patient admission rates to staff emergency rooms correctly during flu season.
Which Methods Work and Why They Break
Predictive analytics uses machine learning algorithms, statistical models, and time series analysis to identify patterns in historical data. Popular tools include Python scikit-learn, R statistical packages, and enterprise platforms like IBM SPSS or Microsoft Azure ML. Models break when underlying business conditions change — COVID-19 destroyed most demand forecasting models overnight. Data quality problems make garbage predictions regardless of sophisticated algorithms. Another limitation is the black box problem, where models make accurate predictions but nobody understands why they work or when they might fail.
What Should You Do About Tomorrow's Problems?
Prescriptive analytics, the most advanced of the four types of analytics, tells you which fix to choose when you have ten options. Companies use it when decisions cost millions and guessing wrong kills quarters. Sometimes recommendations work in theory but break in practice.
What Decision Control Delivers and What It Demands
Prescriptive analytics ranks options and picks the best one based on constraints and goals.
- Supply chain systems recommend inventory levels that minimize costs while meeting demand.
- Pricing engines suggest optimal product prices that maximize profit without losing customers.
- Marketing platforms choose which customers get which offers to improve conversion rates.
The benefit is speed—machines evaluate thousands of scenarios faster than human teams. The demand is trust because you follow recommendations without understanding why they work. When models fail, entire business units can collapse overnight.
Where Enterprises Trust Machines to Choose Actions
- Manufacturing plants use optimization engines to schedule production runs that minimize waste and meet delivery deadlines.
- Energy companies deploy algorithms that balance power grid loads during peak demand periods.
- Financial firms rely on trading systems that buy and sell securities based on market conditions.
- Logistics operations use route optimization software that cuts fuel costs by planning delivery schedules.
- Airlines employ revenue management systems that adjust seat prices every few minutes to maximize flight profitability.
Which Systems Work and Why They Fail
Prescriptive analytics combines optimization algorithms, simulation models, and decision trees to evaluate options and recommend actions. Tools include specialized platforms such as IBM CPLEX and Gurobi optimization, as well as cloud services like AWS Forecast. Systems fail when real-world constraints differ from model assumptions—labor strikes shut down optimized supply chains instantly. Another failure point is competing objectives because maximizing profit often conflicts with customer satisfaction or employee welfare. The biggest risk is automation bias, where teams stop questioning machine recommendations even when business conditions change dramatically.
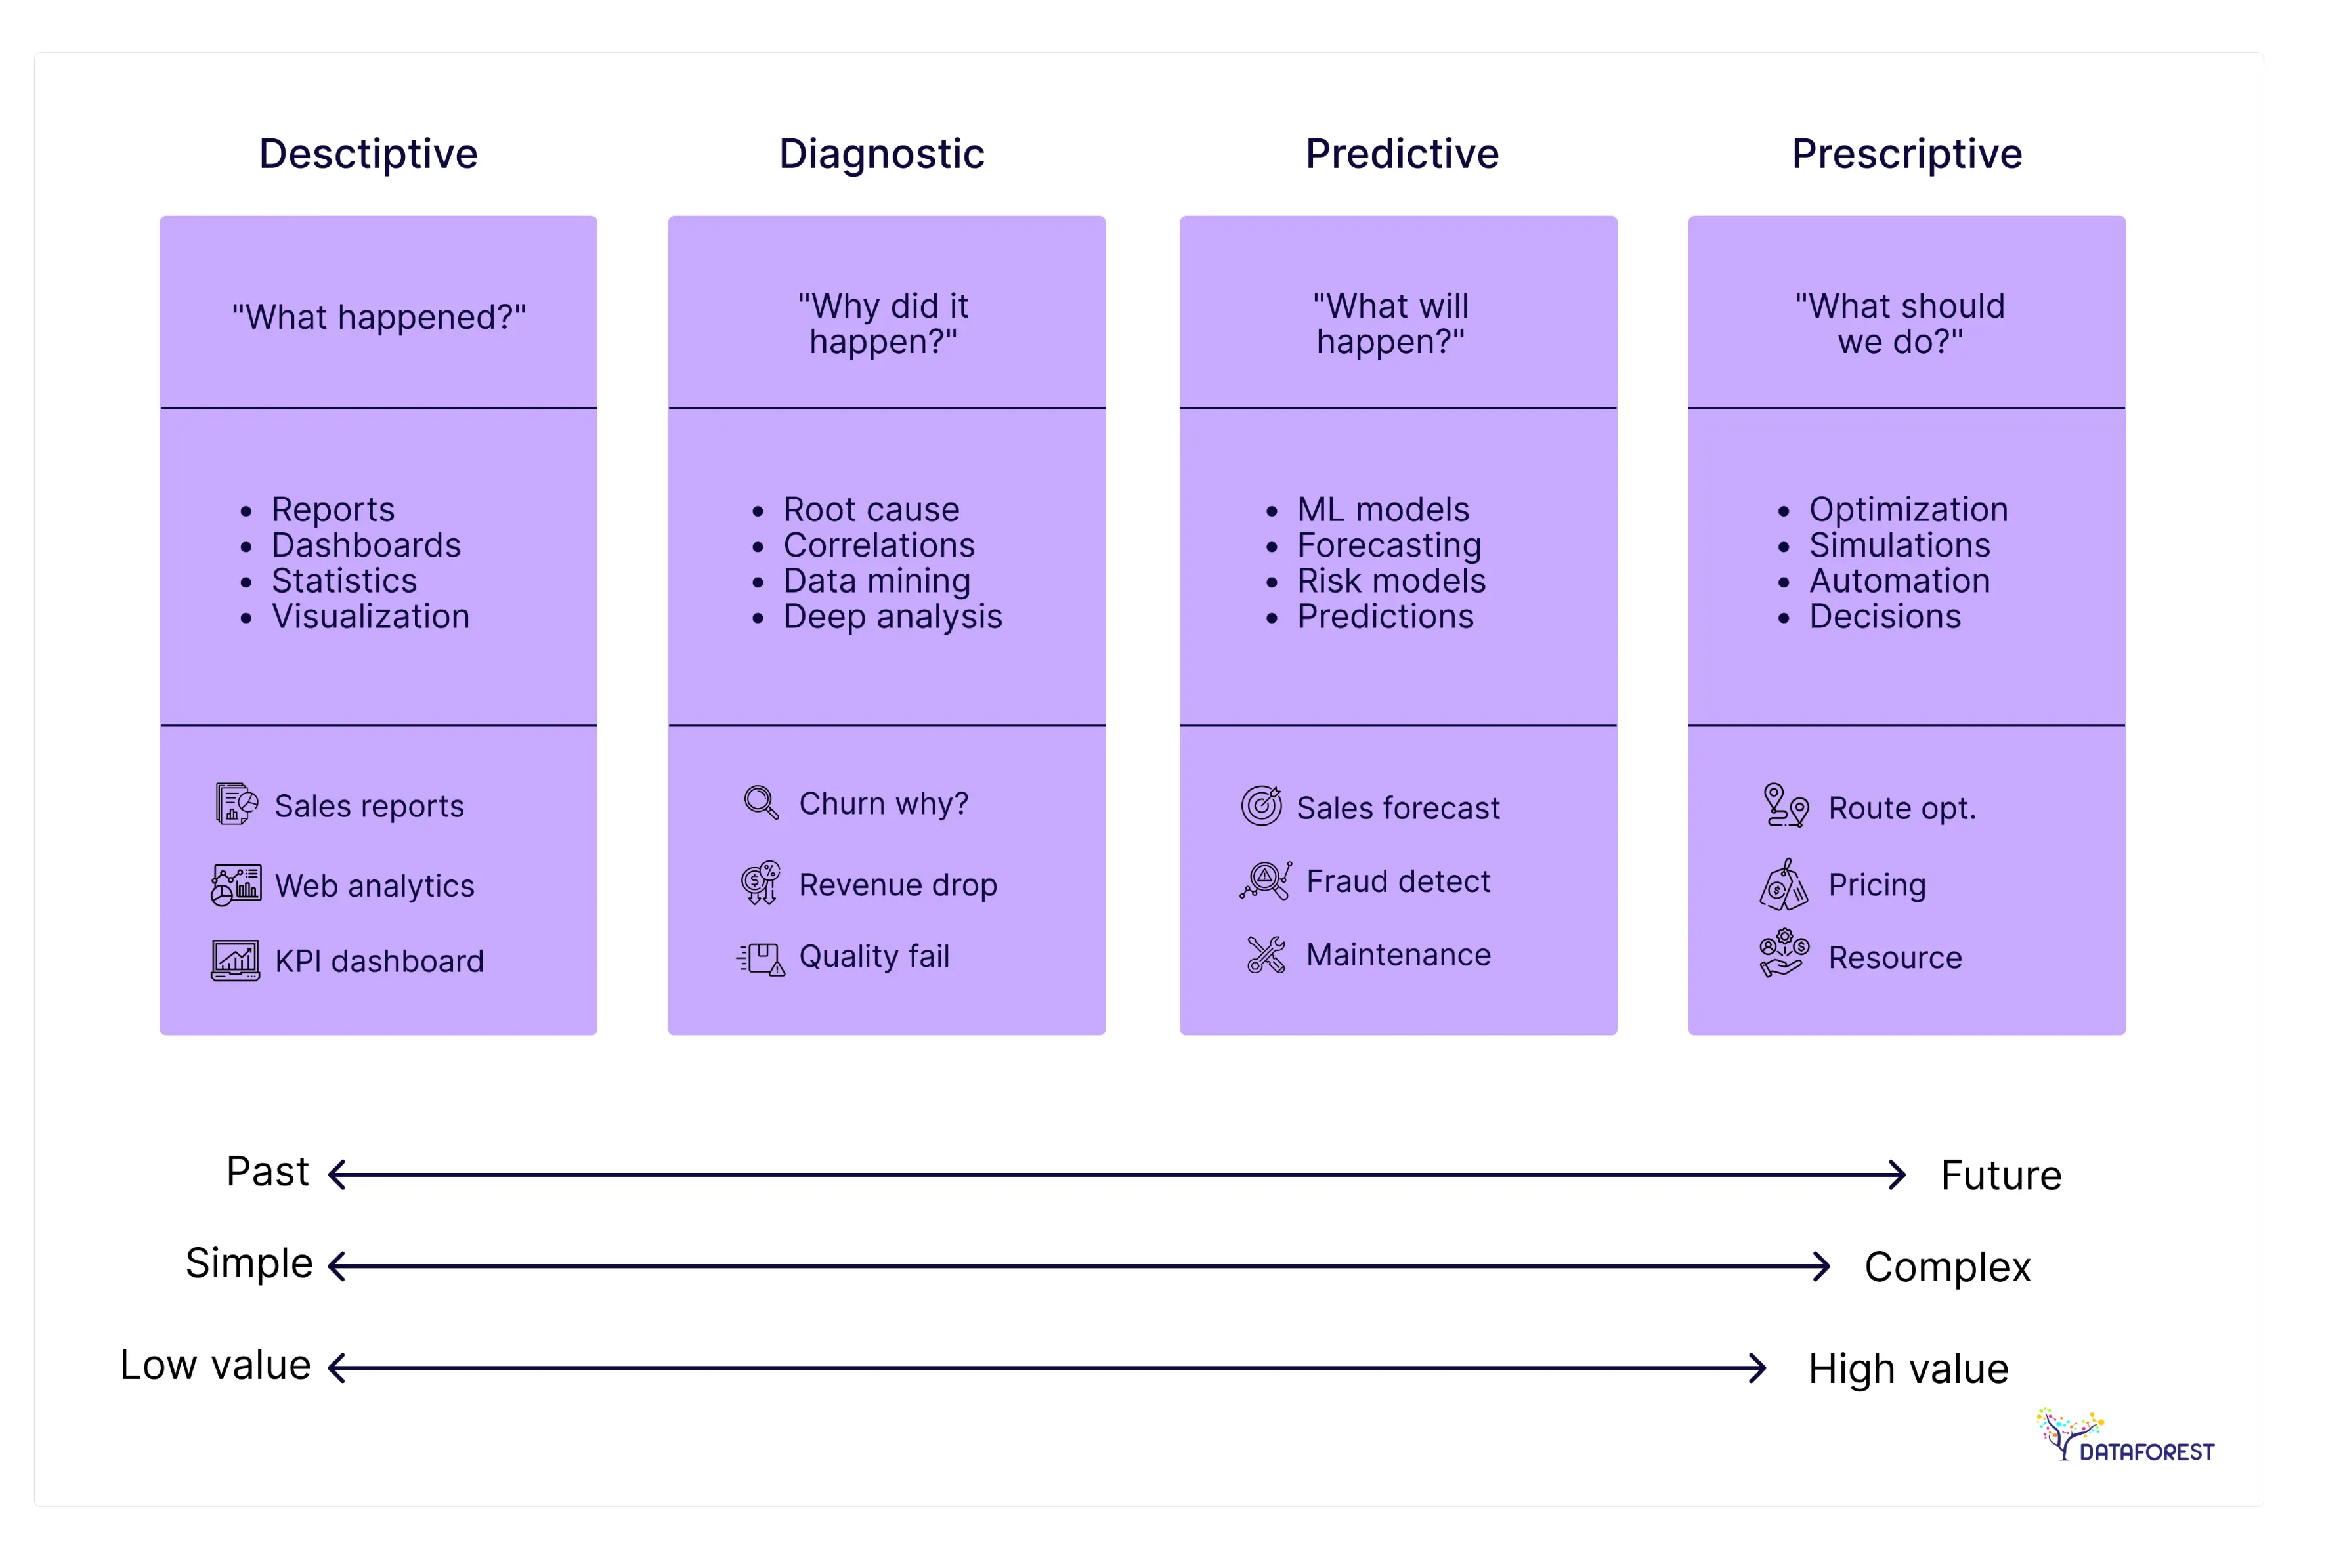
Data Analytics Types Comparison Matrix
This matrix clarifies the differences between the types of data analytics: descriptive, diagnostic, predictive, and prescriptive.
Select what you need and schedule a call.
How Will AI Change What Analytics Can Control?
AI promises to make the analytics types examples faster, smarter, and more autonomous. Companies rush to adopt artificial intelligence in analytics without understanding what changes and what stays broken. The real question is whether machines can handle business complexity better than humans.
Why Executives Stopped Reading Their Own Reports
Traditional BI systems presented charts to managers, who had to interpret their meaning using standard data analysis methods. Now AI looks at those same charts and explains the story behind them in an everyday conversation. Instead of staring at a revenue dip and wondering why, you can literally ask the system, "What caused this drop?" and get a coherent answer. The shift is profound because it changes who does the thinking—humans used to interpret data, now machines interpret it for us. The catch is that when AI gets the interpretation wrong, most people lack the skills to catch the mistake.
When Machines Started Making Smarter Guesses Than Humans
AI doesn't just predict better—it predicts differently by processing signals humans miss entirely. Traditional models used 20 variables to forecast demand; AI models, on the other hand, crunch thousands of data points, including weather patterns, social media sentiment, and economic indicators, simultaneously. The breakthrough happens in prescriptive analytics, where AI doesn't tell you what might happen, but runs millions of "what if" scenarios to find the optimal response. Instead of choosing between three strategic options, you get ranked recommendations across dozens of variables with confidence scores attached. The tricky part is that these enhanced decision support systems work brilliantly until they encounter situations outside their training data, then they fail spectacularly while still appearing confident about their recommendations.
The Robots That Never Sleep
Autonomous analytics agents actually manage chunks of your business while you're sleeping or in meetings. These systems are with performance monitoring, so they detect when something's going wrong, figure out why it happened, and implement fixes before anyone even knows there was a problem. Amazon's pricing algorithms, for example, adjust millions of product prices throughout the day based on what competitors are charging, the amount of inventory in warehouses, and the level of demand they're experiencing.
You get round-the-clock optimization that reacts way faster than any human team could manage. But when the agents misread the situation or start optimizing for the wrong things, they can wreck months of careful work in a few hours, all while confidently explaining why their choices were wise.

Will Your Company Win or Lose the Analytics War?
Every company talks about becoming data-driven, but most fail to execute. The winners separate themselves by solving four critical problems that destroy analytics initiatives. The losers keep hiring data scientists while their competitors eat their lunch.
Why Companies Fail at Analytics Beyond the First Department
Companies start analytics in one corner of the business and hit a wall when they try make scaling data analytics everywhere else. Marketing builds customer models that finance can't understand, while IT creates data pipelines that operations teams refuse to use because the definitions don't match their daily reality. The problem is that departments hoard their data like secrets and resist sharing real-time insights that might expose mistakes. Success comes from agreement on definitions. So, when marketing says "customer acquisition cost," it means the same to finance and operations. Companies that solve this coordination nightmare make decisions faster than competitors who still waste months arguing about whose numbers are correct.
Why Data Analytics Jobs Are Getting a Complete Makeover
The biggest shift isn't that AI is replacing data analysts—it's that the job itself is fundamentally changing from technical execution to strategic thinking. Routine data cleaning, basic data reporting, and standard visualizations are being automated, which means companies no longer need as many people who can write SQL queries or build dashboards. Instead, they're hunting for people who understand what questions to ask in the first place, can spot when AI-generated insights don't make business sense, and can explain complex findings to executives who barely know what a pivot table is. The sweet spot lies with professionals who combine industry knowledge with the ability to guide AI tools effectively. What's fascinating is that this shift rewards curiosity and communication skills over pure technical chops.
When Your AI Model Needs to Show Its Work
Most AI models in data analytics work like black boxes—they spit out predictions or insights, but nobody can explain why they reached those conclusions, which creates massive trust and liability issues. Traditional machine learning prioritizes accuracy over transparency, resulting in systems that may be 95% accurate but remain completely opaque when they make mistakes or biased decisions. Responsible AI means building accountability into the process from day one—tracking data sources, documenting model assumptions, testing for bias across different groups, and creating audit trails that regulators and stakeholders can actually follow. Business leaders need to understand why the AI recommended laying off certain employees or flagging specific loan applications before they act on those insights. The transparency requirement is making modern analytics teams better at their jobs, forcing them to think carefully about data quality and model design.
Every Company Is Scrambling to Get Smarter Faster
The real competitive advantage is AI that learns from your specific business faster and better than your competitors can copy. Companies are discovering that generic analytics tools give everyone the same insights, but the winners are those who can spot patterns in their unique data that nobody else can see or act on. Think of it like having a chess grandmaster who's studied every game your opponent has ever played while they're still figuring out how the pieces move. The truth is that once your competitor figures out your AI-driven edge, the only way to stay ahead is to be already working on the next breakthrough, which means this becomes an expensive, never-ending cycle.
How DATAFOREST Turns Raw Data into Actionable Intelligence
DATAFOREST helps companies transform raw data into actionable insights by mastering the four types of analytics.
- We build the plumbing—ETL pipelines, integrations, and clean data lakes—so analytics aren't built on shaky ground.
- Then we move into deeper analysis, using predictive models for churn, pricing, recommendations, or anomaly detection to spot what's coming before it hits.
- The team utilizes generative AI for copilots, workflow automation, and report generation, thereby alleviating repetitive tasks from individuals' workloads.
And because businesses don't all look the same, we design tailored platforms—such as real-time e-commerce analytics or healthcare intelligence tools—that speed up decisions and uncover insights that would otherwise remain hidden. Please complete the form to use our experience in different types of data analytics.
FAQ On Four Types of Analytics
What is the difference between business intelligence (BI) and data analytics?
Business intelligence focuses on describing what has already happened, often through dashboards and reports. Data analytics—and specifically the four types of analytics—goes further by uncovering patterns, predicting future outcomes, and guiding decisions. In short, BI looks back, while analytics looks forward and deeper.
How do data analytics improve customer experience in retail and e-commerce?
Analytics helps businesses understand buying behavior, preferences, and drop-off points in the customer journey. With that insight, they can personalize offers, optimize product recommendations, and streamline checkout flows. The result is a more engaging shopping experience that drives loyalty.
What are the most common mistakes companies make when implementing analytics?
One mistake is jumping straight into tools without fixing underlying data quality issues. Another is ignoring clear business goals, which leaves analytics efforts directionless. Many also underestimate the need for cultural adoption, where teams must actually use the insights provided.
Which industries gain the most competitive advantage from advanced analytics?
Retail and e-commerce thrive on analytics-driven personalization and inventory forecasting. Finance and insurance depend on analytics for fraud detection, risk modeling, and compliance. Healthcare also benefits from using analytics to improve diagnostics, optimize treatment plans, and manage resources.
What role does data quality play in the success of analytics projects?
Poor data quality leads to misleading results, wasted resources, and bad business decisions. High-quality, consistent data ensures that analytics models reflect reality and can be trusted. Without it, even the most advanced algorithms fail to deliver value.
How do cloud platforms change the way enterprises use analytics?
Cloud platforms make large-scale storage and real-time processing accessible without massive upfront investment. They simplify collaboration by giving distributed teams access to the same datasets and tools. The flexibility lets enterprises scale analytics quickly and adapt as data volumes grow.


%20(1).webp)