
In today's hyper-competitive landscape, the old way of managing utilities is no longer fit for purpose. Relying on reactive fixes and month-old data is an expensive habit that bleeds resources. Forward-thinking enterprises are moving beyond this, embracing a proactive, data-centric strategy: utility real-time monitoring. This isn't just about putting a meter reading on a screen; it's about building an intelligent nervous system for your physical assets. This architecture is the critical link that turns the raw language of pipes and meters into the actionable insights of analytics and forecasting.
For any leader serious about building a resilient and efficient enterprise, getting a firm grasp on this architectural evolution is a strategic imperative. It's the key to unlocking tangible, board-level advantages that directly impact the bottom line, risk profile, and corporate reputation.
The Strategic Imperative: Key Business Benefits of Real-Time Utility Monitoring
Reduced Operational Costs through Data-Driven Optimization
The most immediate benefit is a significant reduction in operational expenditure (OpEx). Insights from McKinsey & Company show that digital initiatives in utilities can slash OpEx by up to 25%. A real-time utility monitoring system provides the granular visibility to identify waste, correct inefficiencies, and optimize consumption patterns. This could mean fine-tuning HVAC cycles based on real-time occupancy or avoiding peak demand charges in a manufacturing plant. It’s a direct path from data to dollars saved.
Improved Resource Efficiency and Sustainability
In an era of stringent ESG (Environmental, Social, and Governance) mandates, efficient resource management is non-negotiable. Real-time utility consumption tracking is the foundation of any credible sustainability program. By precisely measuring water, gas, and electricity use, organizations can set meaningful reduction targets and validate efficiency initiatives with verifiable data. The U.S. Department of Energy estimates that smart building controls can cut energy costs by 10-30%, a figure that translates directly into a smaller carbon footprint.
Early Alerts for Anomalies and Risk Prevention
Waiting for a monthly report to discover a major leak or equipment failure is like reading yesterday's news. The damage is already done. A real-time site utility monitoring platform functions as a digital nervous system, feeling problems the instant they happen. By learning the normal rhythm of your operations, the system can immediately flag any deviation from the baseline—a pressure drop in a water main, an abnormal energy draw from a machine, or a subtle temperature change in a critical component. This early warning is the very essence of predictive maintenance, giving teams the power to intervene with surgical precision long before a minor fault becomes a catastrophic failure.
Better Regulatory Compliance and ESG Reporting
The demand for transparent, accurate ESG reports and regulatory filings has never been higher. Manual data collection is a recipe for errors and a drain on resources. An automated system provides an auditable, single source of truth, capturing data with unwavering consistency. This turns the arduous task of compliance reporting into a streamlined process, building trust with agencies and investors while minimizing the risk of penalties.
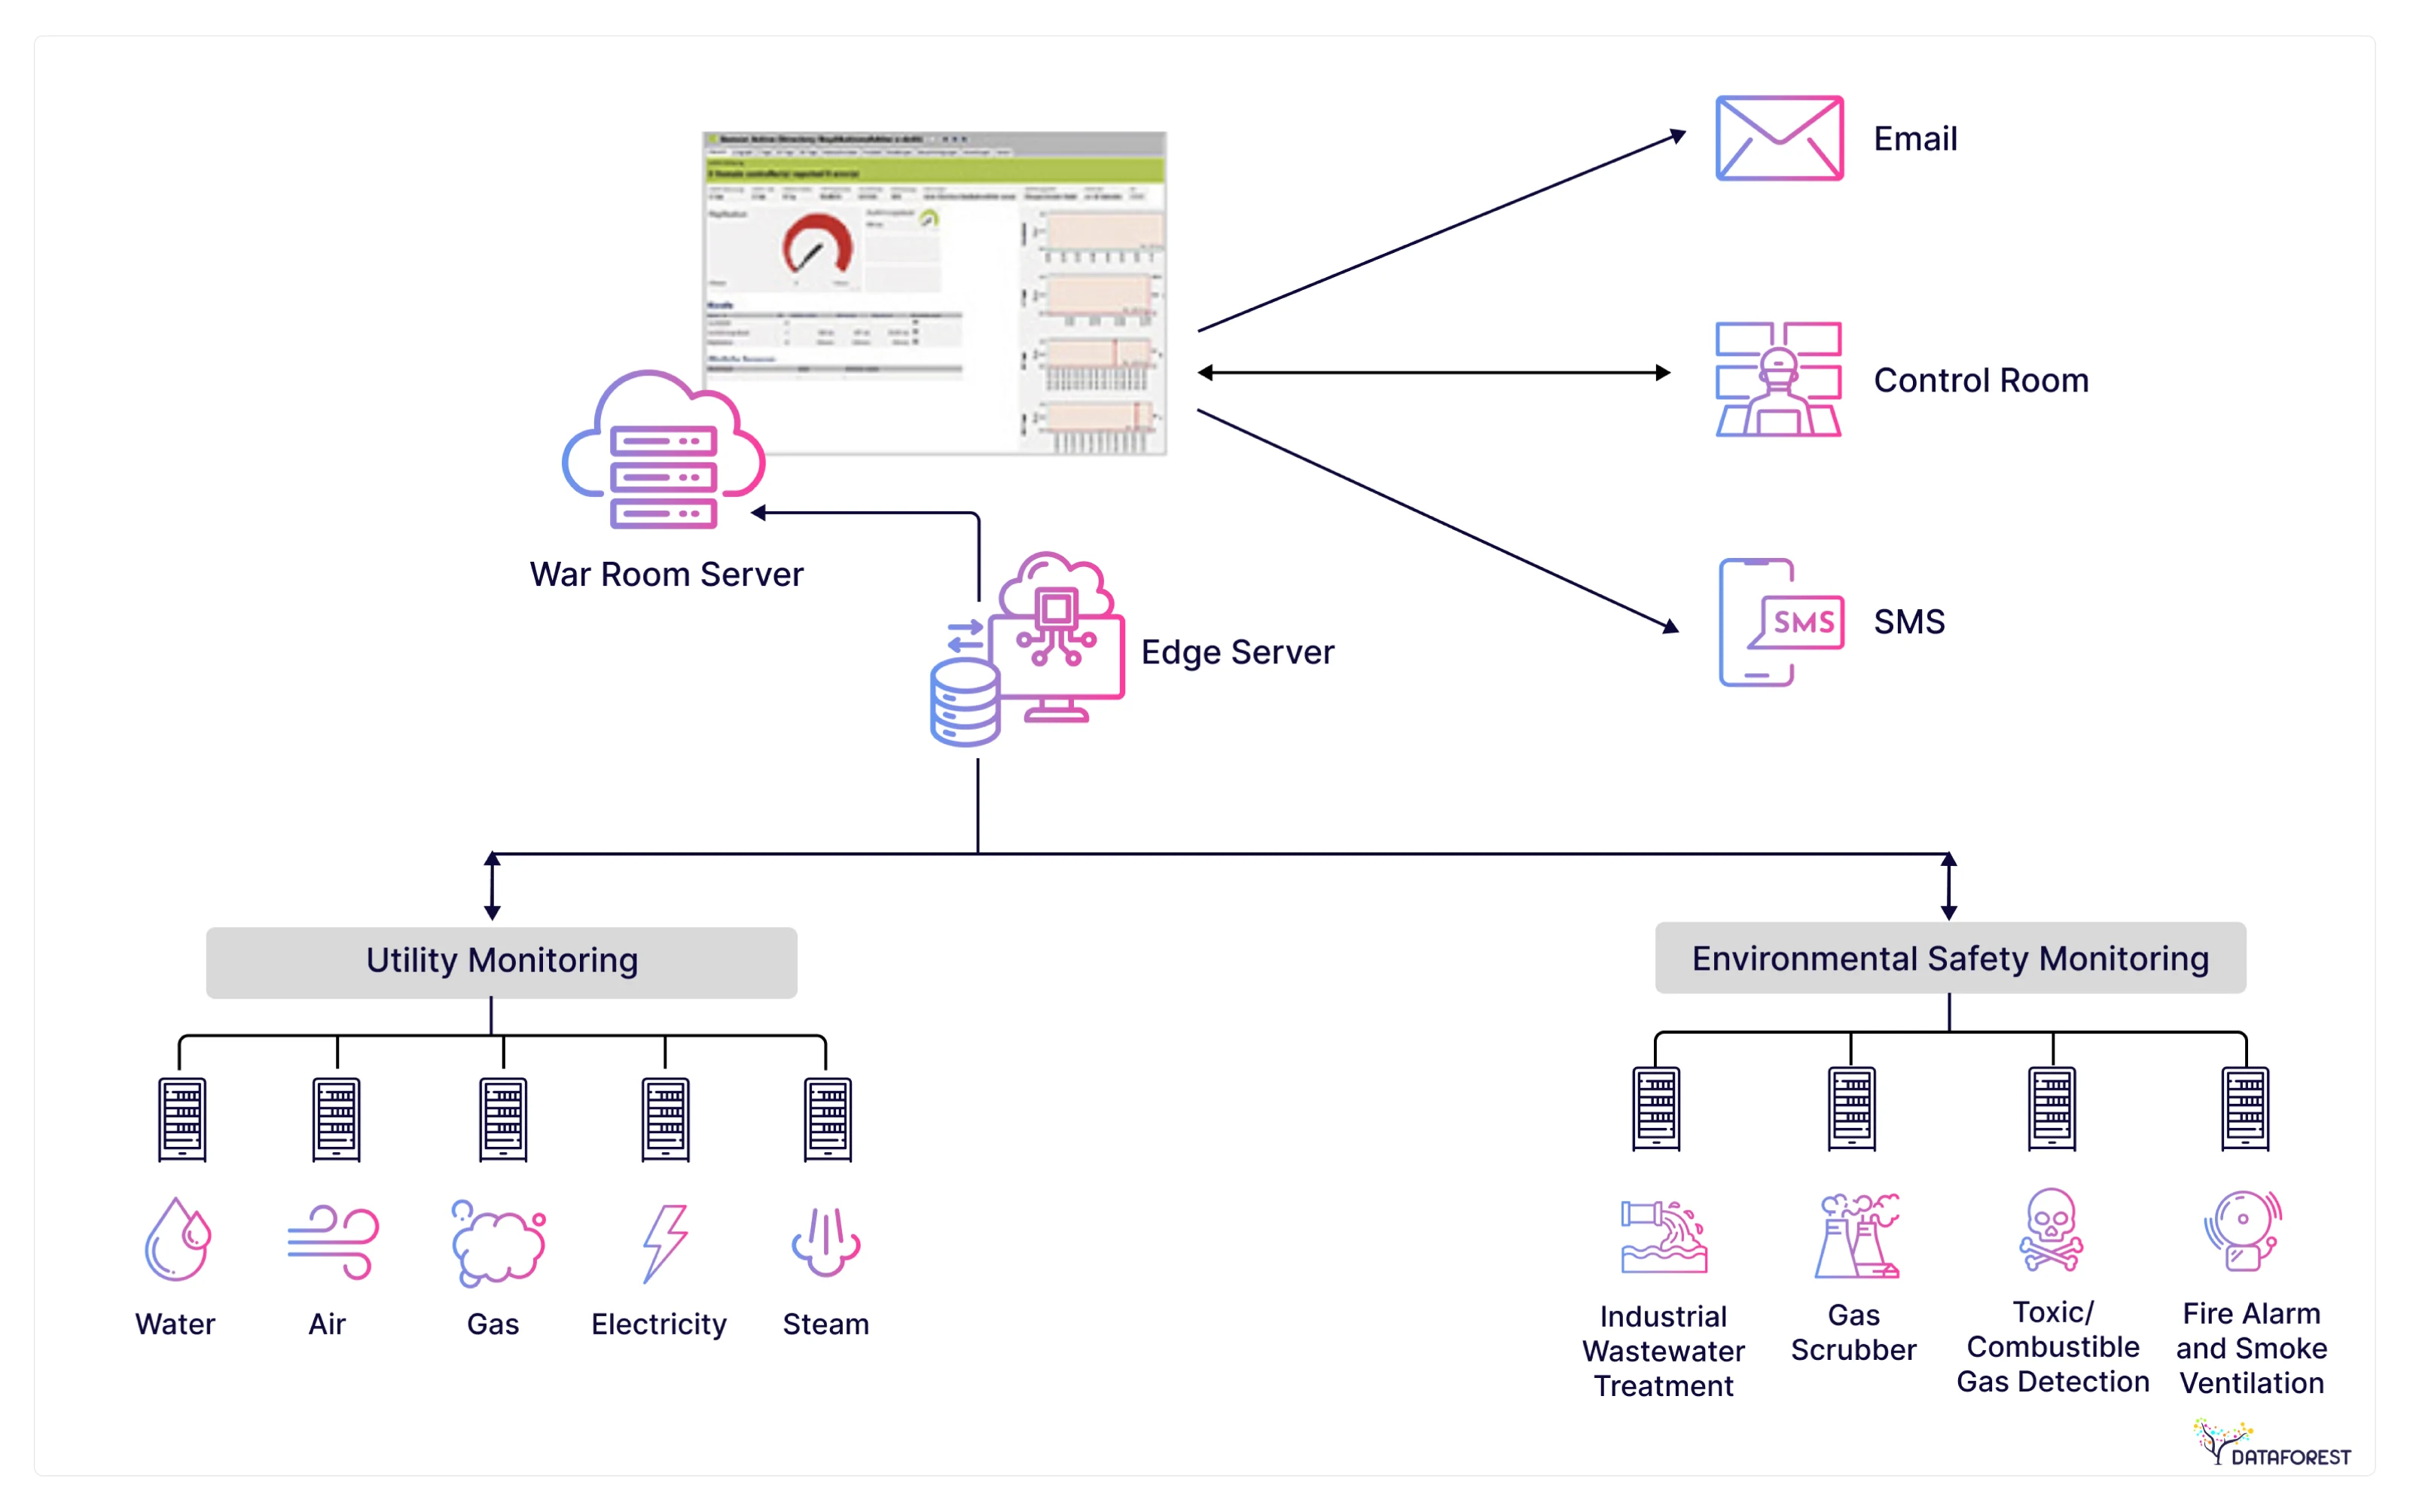
Architecture Overview: From Physical Sensors to Web Dashboards
So how is such a system built? Its design is a multi-layered blueprint for intelligence, where each piece is vital to turning raw signals into strategic insight. This modern architecture implements a clear separation of concerns across its layers, ensuring scalability and maintainability from the sensor to the browser.
Layer 1 – Data Acquisition (Sensors & Smart Meters)
It all begins with the system's sensory organs: a network of smart meters and sensors collecting data directly from the utilities embedded within your core physical infrastructure. These devices, from a simple utility monitoring device to complex meters, are your source of truth on the ground.
Layer 2 – Edge Gateways and Protocol Translation
Sensors often speak different languages (Modbus, BACnet, LoRaWAN). An edge gateway acts as a local translator and aggregator. Deployed on-site, it collects data, normalizes protocols into a unified format, and performs initial filtering. This reduces the data volume sent to the cloud, lowers latency, and enhances security by buffering the internal OT (Operational Technology) network from the external world.
Layer 3 – Data Ingestion via Streaming (MQTT / WebSocket / Kafka)
With data pre-processed at the edge, it needs a superhighway to the central back-end. This is the domain of real-time data streaming. Think of protocols like MQTT as hyper-efficient couriers, designed for IoT environments to deliver messages reliably even over spotty connections. For the heaviest traffic—data from thousands of endpoints—platforms like Apache Kafka act as a multi-lane expressway, a robust, fault-tolerant backbone for massive data streams. This ensures the data pipeline won't buckle under pressure and can scale as you grow.
Layer 4 – Cloud / Hybrid Back-End for Processing & Storage
This is the command center where the real magic happens. Whether it lives in a public cloud, on your own servers, or a mix of both, the back-end is where raw data is forged into strategic fuel. Here, incoming data streams are processed, cross-referenced with contextual information, and stored in high-performance time-series databases built for speed and complex analysis. This cloud-native environment is also the playground for your AI, where machine learning models sift through petabytes of data to find the patterns that drive your business forward. Leveraging expert Cloud Architecture Design Services is a critical step for scaling effectively.
Layer 5 – Browser-Based Frontend with Real-Time Dashboards
The final layer is the human interface, where data becomes insight through rich data visualization. The result? Dashboards that are alive with data, built as a single-page application (SPA) that communicates constantly with the back-end. Using WebSockets and modern APIs, they receive a continuous flow of updates, refreshing dynamically to give every stakeholder an intuitive, customized view of the operational landscape, from the field to the boardroom. Developing such an interface often requires specialized Web & Mobile App Development expertise.

Business Challenges and How Modern Web Architecture Solves Them
Transitioning to a real-time system is not without hurdles. A well-designed modern architecture, however, directly addresses the primary business challenges.
Legacy Infrastructure and Fragmented Systems
Many enterprises operate with siloed, proprietary utility monitoring and control systems (like older SCADA platforms) that prevent a holistic view of operations. Modern architecture, built on open standards and APIs, solves this through effective Data Integration. It creates a unified data pipeline that breaks down silos and establishes a single source of truth, a core component of any Digital Transformation strategy.
Real-Time Data Bottlenecks and Latency Issues
Traditional batch-processing systems cannot support real-time decisions due to inherent latency. Modern streaming architectures and edge computing are designed to minimize this latency. This ensures alerts are instantaneous and dashboards reflect the ground truth with millisecond accuracy, a process that can be fine-tuned through expert Performance Troubleshooting.
Security and Data Integrity Risks
Connecting operational technology to the internet introduces new security vectors. Modern architectures address this with a defense-in-depth strategy, including secure edge gateways, end-to-end data encryption, and robust identity and access management (IAM) policies in the cloud. This layered security model protects data integrity from sensor to browser.
Lack of User-Friendly Visualization for Decision Makers
Too often, critical operational data is trapped in legacy software with clunky, unintuitive interfaces—effectively becoming data graveyards. A modern utility monitoring platform shatters this mold. It prioritizes the end-user, delivering insights through clean, intuitive dashboards and reports that don't require an engineering degree to understand. Through this user-centric approach, the customer unlocks data that was previously inaccessible or incomprehensible. This dedication to superior data visualization drives customer engagement and empowers faster, smarter decisions, much like a well-executed Supply Chain Dashboard can bring clarity to byzantine logistics.
Use Cases from Large Enterprises and Utilities
The real-world impact of this architecture speaks for itself. Let’s look at how it plays out.
Energy Company: Grid Monitoring and Load Forecasting
For an electric utility, grid stability isn't just a goal; it's the entire business. By deploying sensors across the grid, these companies get a live, high-fidelity picture of network health. This data stream fuels a central energy management system where AI models work constantly to predict load changes and pinpoint potential outage risks before they impact customers.
Smart Buildings: HVAC and Water Monitoring in Real Time
Imagine a large real estate portfolio, now managed with surgical precision. That's the power of smart building automation. Instead of running on fixed timers, HVAC and lighting systems respond to live occupancy data. Water leaks are flagged the second a flow meter detects an anomaly. This isn't just about cutting utility bills; it's about creating superior tenant experiences and hitting ambitious sustainability targets.
Manufacturing: Utility Usage Optimization in Plants
In any manufacturing operation, utilities are a significant line item on the P&L. A modern utility monitoring system can drill down to track the energy and water draw of every single machine on the factory floor. By correlating consumption data with production schedules, managers can spot inefficient assets and shift heavy loads to off-peak hours, turning the plant into a model of efficiency.
Key Considerations for Implementation and Scaling
The potential is clear. The question is how to make it a reality. It requires thoughtful planning and a few critical decisions.
Build vs. Buy: Choosing a Platform or Custom Solution
You face a classic strategic choice: adopt an off-the-shelf utility monitoring platform or build a bespoke solution. Buying gets you to market faster, but you may have to bend your processes to the software. Building is a heavier lift upfront but results in a solution that is a perfect glove-fit for your unique operational DNA. The right path depends on your specific needs, in-house talent, and long-term vision.
Cloud vs. On-Prem vs. Hybrid Deployment Models
Where your system's brain lives is another crucial decision. A full-cloud deployment offers maximum scalability and frees you from managing hardware. On-premises delivers absolute control, often a necessity for certain regulated industries. A hybrid model, in turn, provides a strategic balance, pairing the agility of the cloud with the strict governance of on-prem control. A Cloud Migration as a Service partner can be invaluable in navigating this choice.
Total Cost of Ownership (TCO) and ROI Forecasting
But regardless of the model you choose, the conversation always comes back to the numbers. A smart investment decision goes beyond the initial price tag. You must map out the Total Cost of Ownership (TCO)—factoring in hardware, subscriptions, maintenance, and talent. A rigorous TCO analysis, when compared against the projected ROI from dramatic cost savings and mitigated risks, forms the unshakable foundation of your business case. Prioritizing Infrastructure Cost Optimization from day one is essential to making the numbers work in your favor.
Choosing the Right Technology Partner
The ambition of a real-time monitoring initiative can live or die by the quality of your implementation partner.
What to Look For: Expertise, Portfolio, Support, Scalability
When you're vetting a partner, don't settle. Demand proven, hands-on expertise in cloud-native development, data engineering, and the Internet of Things. Scrutinize their portfolio for work that mirrors your challenges, like delivering successful Infrastructure Audit & Intelligent Notifications. Confirm they provide rock-solid support and, most importantly, that they think in terms of scalable, future-proof architectures that will grow alongside your business.
How We Help Enterprises Deploy Real-Time Utility Monitoring Solutions
At Dataforest, this is our native territory. We are architects and builders of the sophisticated data systems that drive modern business. Our expert team brings a potent blend of data engineering, DevOps, and web development to the table, creating seamless end-to-end solutions for utility real-time monitoring. We're not just contractors; we're partners. We design resilient data pipeline ETL intelligence, optimize your cloud spend, and craft the intuitive SPAs that make your data accessible and powerful. From the initial whiteboard sketch to full-scale deployment, our mission is to help you transform your raw operational data into your most valuable strategic asset.
Charting the Course for a Smarter Future
Let's be clear: the move to utility real-time monitoring is no longer a distant vision, but a present-day competitive necessity. The architecture connecting your sensors to your strategy dashboards is the nervous system of a truly modern, efficient enterprise. It's what empowers you to finally stop reacting and start predicting. By committing to a robust, scalable architecture, you unlock a panoramic view of your operations, drive down costs, and insulate your business from risk. You build a powerful foundation for the future. The first step isn't a purchase order; it's a strategic decision to master your data.
Ready to unlock the full potential of your utility data? Contact us to discuss how we can help you build a state-of-the-art monitoring solution.
FAQ
What business processes can be improved through real-time utility monitoring?
Real-time monitoring enhances several core processes. Predictive maintenance can be implemented by detecting equipment anomalies before failure. Energy management is improved through load balancing and waste reduction. Financial planning becomes more accurate with precise consumption data. Finally, compliance and ESG reporting are automated and streamlined.
How accurate and stable is real-time data visualization?
Exceptionally so. The accuracy of the readings is down to the physical sensors, but the architectural pipeline itself is designed for rock-solid integrity. By using technologies like WebSockets, the data visualization on your screen is a live, stable feed with near-instantaneous updates, not a shaky or delayed picture.
What are the business benefits of transitioning from legacy SCADA systems to modern web-based monitoring solutions?
It’s a leap forward in three key areas: freedom, power, and intelligence. You get the freedom of web-based access from anywhere, breaking free from the on-site terminal. You get the power of cloud-native scalability that grows with you. And you get the intelligence of seamless AI/ML integration, enabling true predictive maintenance and analytics that are nearly impossible to bolt onto rigid, legacy SCADA environments.
How secure is real-time utility monitoring across the web, and what best practices are recommended?
Security is a foundational design principle. Best practices include a multi-layered approach: secure edge gateways, end-to-end encryption, strict Identity and Access Management (IAM) policies, private cloud networks (VPCs), and regular security audits. When properly architected, these systems are highly secure.
What types of dashboards and visualizations are most effective for utility managers and executives?
Effectiveness depends on the role. Managers benefit from granular dashboards showing time-series graphs and alert lists. Executives need high-level dashboards that visualize Key Performance Indicators (KPIs). Technically, the most effective modern dashboards are delivered as a single-page application (SPA) to ensure a fluid, real-time user experience without constant page reloads, presenting data as intuitive gauges and trend lines.
How can AI and machine learning be integrated into real-time utility monitoring for predictive analytics?
AI/ML is integrated at the cloud back-end. The data pipeline feeds sensor data into machine learning models. We train these models to recognize the subtle digital fingerprints that signal an impending failure (for predictive maintenance) or forecast energy demand with uncanny accuracy, a core principle explored in Data Science in Power Generation.


%20(1).webp)


