A 2025 report by the IBM Institute for Business Value (IBV) found that 43% of chief operations officers identify data quality issues as their most significant data priority. And for good reason: over a quarter of organizations estimate they lose more than USD 5 million annually due to poor data quality, with 7% reporting losses of USD 25 million or more.
That number is striking on its own. What makes it worse is that most of those costs are invisible: buried in analyst hours spent chasing down discrepancies, reports that quietly contradict each other, and AI models trained on records nobody verified.
Data quality management (DQM) is the discipline that prevents this. It covers the processes, policies, roles, and tools that define what good data looks like, detect shortfalls, and fix problems at the source rather than downstream. Done well, it is not a cleanup exercise. It is the operational foundation that makes analytics reliable and AI initiatives viable.
Treating data quality as a cleanup task scheduled between projects is the pattern that keeps costs high. The framework covers the core dimensions of data quality, a governance structure with clear ownership roles, a six-phase implementation roadmap, tool selection criteria, and industry-specific applications in healthcare and finance. It applies whether you are starting from zero or trying to mature an existing program.

Key Takeaways
- Poor data quality costs organizations at least $12.9 million a year on average, making DQM a financial imperative, not just a hygiene exercise (see 'The Business Cost of Poor Data Quality')
- Poor data quality drives multi-million-dollar losses per company, with some exceeding $25M annually.
- Data teams spend 30% of their time on quality issues—effectively three full-time roles on a ten-person team consumed by remediation instead of building (see 'The Business Cost of Poor Data Quality')
- In many organizations, poor data quality effectively consumes the equivalent of several full-time roles through remediation, reconciliation, and firefighting.
- Most data quality programs fail because of governance gaps, not bad tools—buying a platform before defining ownership produces dashboards full of red indicators that nobody has the authority to fix. (see '5 Reasons Data Quality Programs Fail')
- Many enterprises invest in AI and data platforms before establishing clear accountability for data ownership, creating visibility into problems without operational mechanisms to resolve them.
- Alert fatigue is a design problem: when monitoring systems generate excessive noise, teams stop trusting them - tune alert volume deliberately rather than accepting every default threshold (see 'AI and Automation in Data Quality Management')
- Mental and operational exhaustion caused by an overwhelming number of alerts can delay responses, reduce effectiveness, and “erode trust” in alert systems.
- Most organizations discover uniqueness failures after the fact rather than blocking them at ingestion—prevention requires ingestion-time deduplication rules, which few teams have in place (see 'The 6 Core Dimensions of Data Quality')
- Databricks discusses deduplication as part of ingestion pipeline engineering rather than downstream remediation. Prevention requires ingestion-time deduplication rules.
What Is Data Quality Management?
The 5 C's of data quality are correct, complete, consistent, current, and contextual. Together, they describe whether data is factually accurate, fully populated, free of contradictions, up to date, and appropriate for the specific use case. Any data quality management program worth running uses these five properties as its baseline measurement criteria.
Core definition and scope
Data quality management (DQM) is the systematic practice of measuring, monitoring, and improving data across its entire lifecycle. It covers the processes, policies, roles, and technologies that keep data fit for its intended use, whether that use is regulatory reporting, operational decisions, analytics, or training AI models. DQM differs from data quality itself: data quality is a property of a dataset; DQM is the organizational discipline that produces and sustains it. In practice, it becomes a foundational layer of modern AI Data Infrastructure, where analytics, automation, and machine learning systems depend on governed, reliable, and continuously validated data inputs. Organizations investing in data platform development often establish data quality management as a core capability to ensure that data products, analytics workflows, and AI applications operate on trusted information.
The scope runs wider than most teams expect. DQM touches for shared reference data, [internal link: data profiling guide] for discovery, for remediation, and for ongoing conformance checks. Many organizations consider data management a top priority for digital transformation, yet a large share of enterprise data falls short of the quality thresholds needed for reliable analytics. That gap is the operational reality DQM exists to close.
Why DQM is an AI readiness prerequisite, not just data hygiene
Treating data quality as a cleanup task scheduled between projects is the pattern that keeps costs high. Poor data quality drives multi-million-dollar losses per company, with some exceeding $25M annually. A model trained on inconsistent or incomplete data doesn't just underperform; it produces confidently wrong outputs at scale.
The engineering cost is equally concrete. Leading organizations treat data quality remediation as an operating-model challenge, not merely a tooling issue, because reactive firefighting consumes substantial engineering capacity. That is, engineering capacity is diverted from building. Automated data quality management reduces that drag, but automation requires clean, well-governed inputs to function reliably. DQM has to come first. Automation built on ungoverned inputs will fail.
The 6 Core Dimensions of Data Quality
The 5 principles of data quality are: define fitness for purpose (quality is relative to use case, not absolute), measure before you fix (profile data before remediating to avoid wasted effort), assign ownership (every data domain needs a named steward accountable for quality), automate monitoring (continuous automated checks replace manual spot-checks that don't scale), and treat root causes (fix upstream sources rather than downstream symptoms to prevent recurring failures).
Understanding each dimension separately matters because they fail for different reasons, and fixing the wrong one wastes time. Pipeline execution faults, ingestion disruptions, schema drift, and real-world variation each map to different dimensions. Programs that treat the six dimensions as an interconnected system sustain quality; those that treat them as a checklist tend to decay between audits.
Accuracy
Accuracy measures whether a data value correctly represents the real-world entity it describes. A customer record showing the wrong billing address is an accuracy failure, not a completeness one. Accuracy is typically validated by comparing records against a trusted reference, a CRM against a postal database, or a financial ledger against a bank statement. It is the hardest dimension to automate because ground truth is often external.
Completeness
Completeness tracks whether all required fields are populated. A sales record missing a product SKU or a patient record without a diagnosis code is incomplete. Measure it as the ratio of populated required fields to total expected fields. Completeness failures are usually the easiest to detect and the first dimension teams instrument when building data quality monitoring.
Consistency
Consistency checks whether the same data point holds the same value across multiple systems or time periods. Consistency failures are where most organizations feel the most operational pain. A customer marked "active" in the CRM but "churned" in the billing system is a consistency failure. Cross-system reconciliation rules and a single source of truth for master records are the standard remedies.
Timeliness
Timeliness measures whether data is available when it is needed and reflects the current state of the world. A daily sales report delivered 48 hours late is technically accurate but operationally useless. Define timeliness thresholds by use case: real-time fraud detection tolerates seconds of latency; monthly financial reporting may tolerate hours. Timeliness SLAs belong in your data contracts, not as informal expectations. [internal link: data governance pillar page]
Validity
Validity confirms that the data conforms to the expected format, type, range, or business rule. A date field containing "N/A", a negative inventory count, or a ZIP code with letters all fail validity checks. Validity rules are the most straightforward to encode as automated constraints, since schema enforcement, regex patterns, and range checks catch most violations at ingestion. [internal link: data validation guide]
Uniqueness
Uniqueness ensures each real-world entity appears only once in a dataset. Duplicate customer records inflate marketing lists, distort analytics, and create compliance exposure. Deduplication logic needs to account for near-matches, such as the same person with slightly different name spellings, not just exact duplicates. Most organizations discover uniqueness failures after the fact rather than blocking them at ingestion; prevention requires ingestion-time deduplication rules, which few teams have in place.
These six dimensions are not independent. A schema drift event can simultaneously break validity, consistency, and completeness in a single pipeline run. Treat them as an interconnected system, not a checklist.

What Are the 4 Pillars of Data Quality?
The 4 pillars of data quality are Accuracy, Completeness, Consistency, and Timeliness. Together, they form the minimum viable standard for data that supports reliable decisions. Accuracy ensures records reflect reality. Completeness means no critical fields are missing. Consistency means the same fact reads the same way across systems. Timeliness means data is current enough to act on.
4 Pillars of Data Quality
- Accuracy
- Completeness
- Consistency
- Timeliness
These four appear in virtually every data quality management framework because they map directly to the ways data fails in practice. A record can be accurate but stale, complete but inconsistent across databases, or timely but riddled with errors. Treating them as a checklist rather than a system is where most programs fall short.
What Are the 5 C's of Data Quality?
The 5 C's of Data Quality extend the four pillars by adding a context dimension. Data can pass every technical check and still be wrong for a specific use case; that's the gap the fifth C addresses. The framework is particularly useful when evaluating data fitness for AI training or regulatory reporting, where context determines whether a technically valid record is actually usable.
5 C's of Data Quality
- Correct—the data accurately reflects the real-world fact
- Complete—no required values are absent
- Consistent—the same value appears uniformly across all systems
- Current—the data is fresh enough for its intended use
- Contextual—the data is appropriate and meaningful for the specific use case
What Are the 5 Principles of Data Quality?
The 5 principles of data quality translate the dimensions above into organizational behaviors. Dimensions describe what quality looks like; principles describe how teams achieve and sustain it.
- Define fitness for purpose—quality is relative to use case, not absolute.
- Measure before you fix—profile data before remediation to prevent wasted effort on low-impact issues.
- Assign ownership—every data domain needs a named steward accountable for quality.
- Automate monitoring—manual spot-checks don't scale; automated data quality management catches drift continuously.
- Treat root causes—fixing symptoms (bad records) without addressing the sources (broken ingestion, schema drift) leads to recurring failures.
The Business Cost of Poor Data Quality
Most organizations underestimate the cost of bad data because the damage is distributed across departments, buried in rework, and rarely attributed to its root cause.
Poor data quality is a quiet cost driver that erodes value long before it is detected
Data sits at the center of the modern enterprise. It shapes strategy, guides decisions, and powers everything from pricing models to automation. As organizations depend more on big data and real-time analytics to support AI initiatives, the cost of poor data quality is harder to ignore.
A 2025 report from the IBM Institute for Business Value found that 43% of chief operations officers view data quality issues as their top data priority. The financial impact is just as stark. More than a quarter of organizations say they lose over USD 5 million each year because of poor data quality, and 7% report annual losses of USD 25 million or more.
The danger is that poor data quality often stays hidden at the source. Its effects usually appear downstream, manifesting as lost revenue, slower operations, compliance exposure, and missed opportunities. By the time the root cause is found, the damage has already spread through systems, datasets, and decisions.
Data quality has to move upstream because AI now consumes data in motion
Traditional approaches, such as checking data quality only within the warehouse, no longer scale. AI systems now interact with data continuously, not in occasional batches. Many depend on streaming or event-driven inputs, which means errors can spread fast.
That is why organizations need to shift left on data integrity. Detection, prevention, and remediation should happen as close as possible to the moment data is created, not after problems surface downstream.
A strong data quality management program helps reduce the cost of bad data. It also creates a real competitive edge in a world where AI and agentic systems depend on trustworthy, real-time inputs.
This requires more than isolated fixes. Organizations need a scalable and repeatable operating model for data quality. That model should define ownership, control, and accountability across the full data lifecycle.
How to estimate your organization's exposure
A rough exposure estimate requires three inputs: your data team headcount, their average fully-loaded cost, and the share of time spent on quality remediation. Multiply headcount by cost by 0.30 to get the productivity loss alone. Add direct financial losses from known bad-data events, such as duplicate payments, compliance penalties, and failed campaigns, in the past twelve months.
That combined figure is your baseline case for investing in a formal data quality management process. In most organizations, even a modest reduction in remediation time pays for tooling and governance overhead within the first year.
How to Build a Data Quality Management Framework
Data quality programs most often fail because ownership is undefined, not because the tooling is wrong. A framework makes that question explicit: who is responsible, what they measure, and how quality connects to the broader data governance program.
Governance layer: ownership, stewardship, and accountability
The governance layer is the foundation. Without it, data quality has no clear owner, and problems go unresolved. Three roles anchor this layer:
- Data Owner—a business-side executive accountable for a data domain (e.g., customer records, product catalog). Owns the definition of "fit for purpose" for that domain.
- Data Steward—an operational role responsible for day-to-day quality monitoring, issue triage, and remediation within the domain.
- Data Custodian—typically an IT or engineering role responsible for the technical infrastructure that stores and moves data.
These roles must be named, not implied. A governance layer that lists job titles without assigning specific domains provides no real accountability.
RACI model for data quality roles
A RACI matrix translates governance intent into operational clarity. Apply it across the four core DQM activities:
The RACI only works if each cell has a named individual, not a team. "The data team" is not accountable; a person is.
Integrating DQM with data governance programs
Data quality management and [data governance](internal link: Data governance pillar page) are not the same program, but they must share infrastructure. Governance sets policy: what data should look like, who can access it, and how long it is retained. DQM enforces that policy operationally, measuring whether data meets the standard and triggering remediation when it does not.
The integration point is the data catalog. Quality scores, profiling results, and issue logs should surface inside the same catalog where governance policies live. Teams that keep these systems separate end up with governance policies that are never validated against real data. Master data management programs, in particular, depend on this integration; master records are only trustworthy if quality rules are enforced at the point of ingestion rather than corrected downstream.
Organizations are investing heavily in the infrastructure that enables this integration, as reflected in the rapid growth of the global data management market in recent years.
Reference frameworks: DAMA-DMBOK and AHIMA
Two established frameworks give your program a credible starting point rather than a blank page.
DAMA-DMBOK (Data Management Body of Knowledge) treats data quality as one of eleven knowledge areas, all of which are governed by a central data governance function. It defines quality management as a cycle: define, measure, analyze, improve, control, a structure that maps directly onto the six-phase process covered in the next section. Data profiling and data cleansing are explicit DAMA-DMBOK activities, not afterthoughts.
The AHIMA DQM model, developed for healthcare data, organizes quality management around 10 characteristics and emphasizes that quality must be assessed relative to the data's intended use rather than against an abstract standard. This use-case framing is useful beyond healthcare: a dataset adequate for operational reporting may be unfit for training a machine learning model.
Neither framework is a plug-and-play solution. Use DAMA-DMBOK to structure governance integration and AHIMA's use-case framing to set domain-specific quality thresholds. Together, they give your program a documented rationale for every structural decision, which matters when you need to defend thresholds to auditors or leadership.
Data Quality Management Process: A 6-Phase Implementation Roadmap
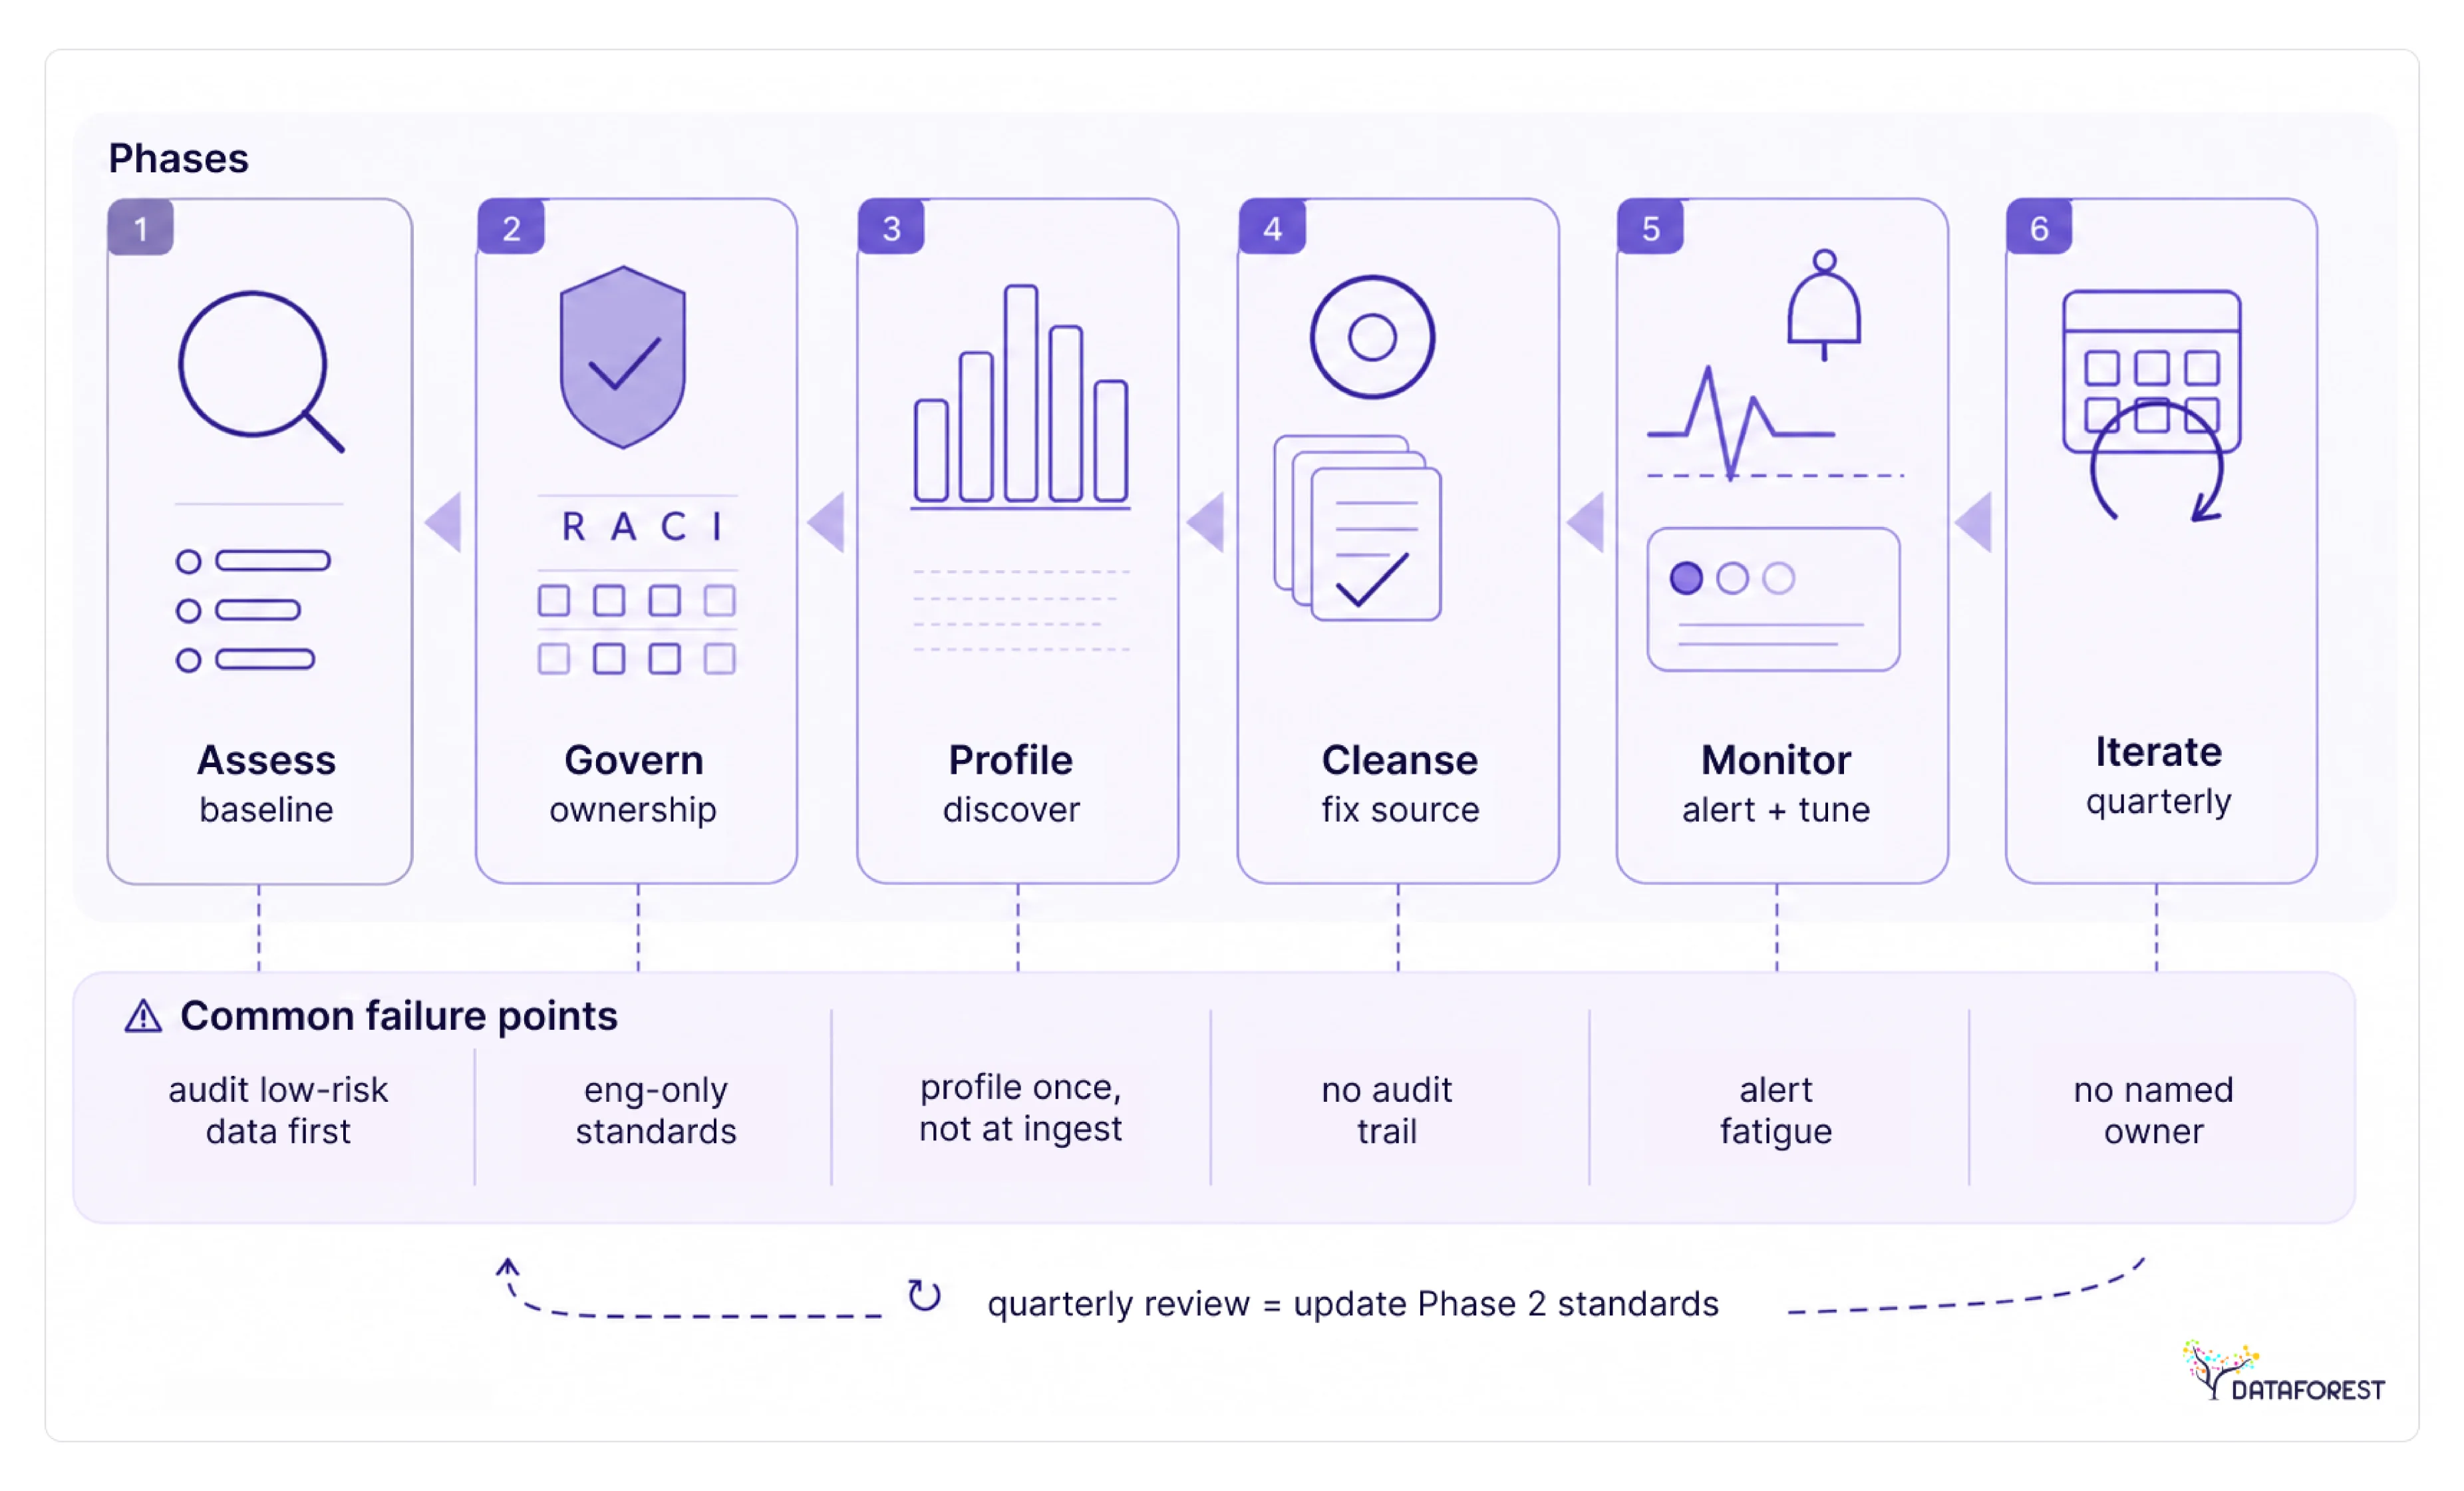
Programs most often stall when teams skip phases: cleansing without profiling first, or deploying monitoring before thresholds are defined. The DQM Implementation Roadmap (assess → govern → profile → cleanse → monitor → iterate) prevents that by making each phase a gate for the next.
Phase 1: Assess—baseline your current state
Before fixing anything, map what you have. Inventory every critical data source, identify which domains feed business-critical decisions, and document known quality complaints from downstream consumers. The output is a prioritized list of domains by risk and business impact, not a comprehensive audit of everything.
Common failure point: Teams audit low-risk data first because it's easier. Start with the domains that feed revenue reporting, compliance, or AI model training.
Phase 2: Govern—establish ownership and standards
Without a named owner, quality standards have no one to enforce them. Assign a named data owner to each critical domain and define quality thresholds and specific, measurable targets for each dimension before data enters production pipelines. Use the RACI model below to prevent accountability gaps.
DQM RACI Ownership Model
Common failure point: Standards defined by engineers alone get rejected by business teams. Data owners must sign off on thresholds before Phase 3 begins.
Phase 3: Profile—discover what the data actually looks like
Data profiling [internal link: Data profiling guide] reveals the gap between what you assumed about your data and what it actually contains. Run profiling scans across completeness, uniqueness, validity, and consistency. Document every anomaly and trace it to a root cause, whether schema drift, ingestion fault, or upstream process failure.
Common failure point: Teams profile once at project start and never again. Profile at ingestion, not only at reporting time.
Phase 4: Cleanse—fix root causes, not just symptoms
Cleansing [internal link: Data cleansing guide] that only patches output records leaves the upstream problem intact. Prioritize remediation by business impact, fix the source process where possible, and maintain a full audit trail of every change. Validate cleansed records against the thresholds defined in Phase 2 before promoting them to production.
Common failure point: No audit trail means you cannot prove to regulators or stakeholders that the data was corrected, or how.
Phase 5: Monitor—detect issues before they cascade
Deploy automated monitoring rules against your defined thresholds. Route alerts to persistent chat channels rather than email; teams respond faster when context and history are visible alongside the notification. Keep alert volume low. Excessive noise trains teams to ignore the channel, including the alerts that matter.
Common failure point: Alert fatigue. Tune rules aggressively in the first 30 days and suppress noise before it trains your team to ignore notifications.
Phase 6: Iterate—close the feedback loop
Schedule quarterly quality reviews to assess whether thresholds still reflect business reality. Update standards after each iteration cycle, since data environments change and rules written six months ago may no longer fit current pipelines. Feed findings back into Phase 2 to keep governance current.
Common failure point: The iteration gets deprioritized when no incident is visible. Make the quarterly review a standing calendar event with a named owner.
Data Quality Metrics and KPIs: What to Measure and How
Most teams track data quality the way they track server uptime, reactively, after something breaks. The smarter approach is a small set of KPIs that surface problems before they reach a dashboard or a decision. The seven metrics below cover every major quality dimension and are concrete enough to automate.
Data Quality KPI Reference Table
Target ranges above are practitioner benchmarks, not universal standards. Adjust thresholds based on your domain; financial data quality management typically demands tighter accuracy targets than internal operational reporting.
Estimating Your Cost Exposure
KPIs only motivate investment when they connect to dollars. Use the framework below to translate metric gaps into a rough cost estimate for your organization. The $12.9 million average annual cost Gartner attributes to poor data quality is an enterprise-level figure; smaller organizations scale proportionally by headcount and data intensity.
Cost-of-Poor-Data-Quality Estimation Framework
What to Automate vs. What Humans Must Own
Automation handles volume; humans handle judgment. Conflating the two is where most monitoring programs break down.
Automate anomaly detection, duplicate identification, and schema drift detection. Reserve human judgment for root-cause investigation and business rule definition; these require domain context, which no automated system currently provides.
- Automated: anomaly detection and alerting
- Automated: duplicate record identification
- Automated: schema drift detection
- Human required: root cause investigation
- Human required: business rule definition
Teams that automate detection and reserve human attention for root-cause and rule definition resolve issues faster and generate fewer false escalations. Automation surfaces the signal; a data steward decides what it means and whether the underlying rule needs updating.
Selecting Data Quality Management Tools: A Decision Framework
Most teams pick data quality management tools based on category familiarity; they buy what they already know, only to discover it solves only part of the problem. A structured selection approach starts with a use case, not vendor reputation.
Tool categories: profiling, cleansing, monitoring, and MDM
Four distinct tool categories address different phases of the data quality management process. Profiling tools diagnose what the data looks like before you act on it. Cleansing tools fix identified problems at the record level. Monitoring and observability tools detect new issues as they emerge in production pipelines. Master data management (MDM) platforms govern the authoritative version of shared entities, such as customers, products, and suppliers, across systems.
Each category has a different integration footprint, automation ceiling, and organizational fit. Choosing the wrong category for a use case is the most common and most expensive selection mistake.
Evaluation criteria for each tool type
The table below maps each tool category against five evaluation dimensions. Use it to shortlist candidates before running a proof of concept.
When to combine tool categories
No single tool category covers the full data quality lifecycle. Teams that have deployed mature data quality programs typically run at least two categories in parallel.
The most common pairing is profiling plus cleansing: profile first to understand the problem scope, then cleanse with targeted rules. Add monitoring once cleansed data enters production pipelines; without it, quality degrades silently between cleansing cycles.
MDM is additive, not a replacement. If your quality problems trace back to inconsistent entity definitions across systems, such as different customer IDs in your CRM and ERP, cleansing alone will not hold. MDM resolves the upstream disagreement that keeps generating downstream errors.
Start with the category that addresses your most acute pain point. Expand the toolset as your data quality management framework matures, not before.
AI and Automation in Data Quality Management
Automation has shifted data quality monitoring from a reactive, ticket-driven process to a continuous one, but it has also introduced a new class of false positives that teams need to manage deliberately.
How ML-based anomaly detection changes monitoring
ML-based monitors learn the statistical baseline of each data asset, including row counts, null rates, distribution shapes, and referential integrity, and flag deviations automatically. This catches issues hours before a broken dashboard surfaces them to a business user. The main benefit is coverage: a team of five data engineers cannot manually watch thousands of tables, but a trained model can.
The catch is noise. A meaningful share of data quality alerts reflect intentional changes and real-world variation rather than genuine errors, which means alert fatigue is a design problem, not just an operational one. Effective automated monitoring requires sensitivity thresholds tuned per asset tier. A single global rule generates too much noise on low-stakes tables and too little on critical ones.
Automated data lineage and impact analysis
When a schema change or pipeline fault triggers an alert, the next question is always: what downstream assets are affected? Automated lineage tools answer that in seconds by mapping column-level dependencies across pipelines, dashboards, and models. Without automation, this impact analysis is manual and slow, often taking longer than the fix itself. Modern data quality management software increasingly bundles lineage with monitoring so teams can triage by blast radius rather than by alert timestamp. Prioritizing high-impact issues first is where automation delivers its clearest ROI.
Limitations: what automation cannot replace
Automated monitors flag deviations but cannot explain them. A sudden drop in transaction volume could reflect a pipeline failure, a genuine business slowdown, or a planned migration; only someone with operational context can tell which. Similarly, defining what "fit for purpose" means for a given dataset, the standard against which automated checks run, requires domain expertise that no model currently supplies. Automated data quality management works best as a detection and routing layer, not as a decision-making one. Keep humans accountable for root-cause classification, threshold governance, and any quality standard that touches regulatory reporting.

Industry Applications: Healthcare and Financial Data Quality Management
Data quality failures in healthcare and finance carry direct consequences: a clinician prescribing the wrong dose, or a bank submitting an inaccurate regulatory report. Healthcare and financial services face the steepest consequences of poor data quality: patient safety in one case, regulatory fines and flawed risk models in the other.
Data quality management in healthcare: patient records, HIPAA, and EHR integrity
The core problem in healthcare data quality is patient identity: the same patient often exists as multiple records across registration systems, EHRs, and billing platforms. When those records diverge, clinical decisions break down. HIPAA audit requirements add a compliance layer, making inconsistent coding not just a data problem but a legal one.
The three failure scenarios that cause the most downstream harm:
- Duplicate patient records are causing medication errors
- Incomplete EHR fields blocking clinical decision support
- Inconsistent diagnosis codes across systems violate HIPAA audit requirements
Addressing these requires a master patient index, a canonical identifier that links records across systems, combined with automated completeness checks on mandatory EHR fields before a record is marked active. Diagnosis code validation rules should run at ingestion, not at audit time. Catching a coding mismatch at data entry is far cheaper than resolving a HIPAA audit finding.
Financial data quality management: regulatory reporting and risk modeling
Financial data quality management operates under a different pressure: regulators expect precise, reproducible numbers on tight deadlines. Basel III, BCBS 239, and Dodd-Frank all assume that the data used to feed risk reports is accurate and traceable. When it isn't, the consequences range from restatements to enforcement action.
The three failure scenarios most likely to surface in regulatory or risk contexts:
- Stale reference data is causing regulatory reporting errors
- Inconsistent counterparty identifiers are distorting risk exposure calculations
- Missing transaction records triggering compliance flags
The fix for stale reference data is a governed refresh schedule with automated staleness alerts, not a manual process that depends on someone remembering to update a spreadsheet. Counterparty identifier inconsistency is a master data problem: without a single legal entity identifier (LEI) mapped to every counterparty record, aggregated exposure figures are unreliable by construction. Missing transaction records require end-to-end reconciliation controls that compare source system counts against the data warehouse on every load cycle.
5 Reasons Data Quality Programs Fail—and How to Prevent Each
Most data quality programs don't collapse because the technology failed. They collapse because of predictable organizational patterns that surface months after launch, when the initial momentum is gone, and the hard governance work begins.
Failure mode 1: tool-first thinking without governance
Buying a data quality platform before defining who owns the data and what "good" looks like is the single most common mistake. The tool surfaces problems no one has the authority to fix. Dashboards fill with red indicators. Nothing changes. Define ownership structures and quality standards first; then select tools that enforce them.
Failure mode 2: no named data ownership
Shared ownership is no ownership. When a quality issue surfaces in the customer domain and three teams each assume another team will resolve it, the issue persists. Every domain needs a named data owner, a specific person rather than a team or committee, accountable for quality outcomes before the program goes live.
Failure mode 3: scope creep beyond initial domains
Early wins tempt teams to expand coverage faster than governance can keep up with. A program that starts with customer data gets pulled into product, finance, and supplier data within six months, before any domain has reached a stable quality baseline. Phase rollout by domain with explicit scope gates: no new domain enters the program until the prior domain meets its defined quality thresholds.
Failure mode 4: governance without enforcement
Policies that carry no consequences are suggestions. If a pipeline can deliver non-compliant data without triggering a block or escalation, it will. Tie quality thresholds directly to pipeline SLAs and build escalation paths that route violations to accountable owners, not just into a log file that no one reads.
Failure mode 5: alert fatigue from over-monitoring
Over-instrumented monitoring produces alert volumes that teams stop reading. When every minor schema variation generates a notification, engineers learn to ignore the channel entirely, including the alerts that matter. Cap alert volume per channel and route notifications to persistent chat, where context and history are visible.
DQM Failure Modes with Mitigation Tactics
- Tool-first thinking without governance: mitigation—define ownership and standards before selecting tools
- No named data ownership: mitigation—assign a named data owner per domain before launch
- Scope creep beyond initial domains: mitigation—phase rollout by domain with explicit scope gates
- Governance without enforcement: mitigation—tie quality thresholds to pipeline SLAs and escalation paths
- Alert fatigue from over-monitoring: mitigation—cap alert volume per channel and route to persistent chat
Data Quality Management Best Practices
Most data quality problems surface at the wrong end of the pipeline: in a dashboard, a regulatory report, or a failed model prediction. By then, remediation costs are substantially higher than catching the same issue at ingestion; rework, downstream corrections, and stakeholder communication all compound the cost of the original fix. The practices below directly address that structural problem.
Shift quality left: catch issues at ingestion, not reporting
Quality gates belong at the point of entry, not downstream. When data lands in your warehouse or lake, automated validation rules should check format, range, referential integrity, and completeness before the record moves anywhere else. Reject or quarantine records that fail; never silently pass bad data forward. Teams that instrument ingestion pipelines with schema validation and null-rate thresholds catch the majority of issues before they compound across dependent systems.
Embed data quality checks directly into ETL or ELT jobs, not as a separate audit step, but as a first-class gate. If a record fails a validity rule, it is routed to a dead-letter queue with a structured error payload, not to a generic failure log. That payload becomes the input for root-cause analysis.
Treat data quality as a product, not a project
Organizations that treat data quality as a project rather than an ongoing function tend to re-run the same remediation work every six to twelve months without reducing the underlying defect rate. Those that treat it as a product, with named owners, defined SLAs, versioned standards, and iteration cycles, build compounding improvements instead.
The product mindset has concrete implications. Data quality SLAs get published and tracked the same way uptime SLAs are. Owners are accountable for dimension scores, not just for fixing incidents when they're reported. Standards are versioned so downstream consumers know what changed and when.
Build a data quality culture across business and engineering
Data quality fails when it's treated as an engineering problem alone. Business users generate, interpret, and act on data; they need to understand quality standards and flag anomalies, not just consume outputs.
Joint ownership is the mechanism: data stewards from business units participate in defining acceptable thresholds, not just receiving reports about them. Engineers build the tooling; business stakeholders set the fitness-for-purpose criteria. Regular, short, structured, and cross-functional quality reviews keep both sides aligned and prevent the slow drift where standards exist on paper but not in practice.
The teams that sustain data quality longest have named owners, published SLAs, and a standing quarterly review. Tooling sophistication is a distant second.
Conclusion
Data quality management is not a cleanup project you run once and close. The real problem most organizations face is treating it that way, reacting to visible failures instead of building the systems that prevent them.
As AI workloads expand, upstream data defects amplify. A model trained on inconsistent records produces wrong answers at scale, not just occasionally. Organizations that build governance and monitoring infrastructure now will spend less time on remediation as AI workloads grow.
Start this week: run a data profiling pass on your single highest-stakes domain, the dataset your most critical report or model depends on. Document what you find. That baseline assessment is Phase 1 of the implementation roadmap, and it costs nothing but time.


.webp)