Fourteen portfolio companies send fourteen different P&Ls, until an AI layer maps them to one schema on arrival
The Challenge
Holding companies, PE firms, family offices and multi-entity operators receive financials from each portfolio company or business unit in a different shape: different charts of accounts, periods, EBITDA definitions and file types. Every reporting cycle, an associate or finance lead rebuilds a dozen or more P&Ls into one comparable view. The work consumes a senior person's week each month and still arrives late, with errors nobody has time to catch.
The board pack is no better. It takes three to four days to assemble from ERP, CRM and operational systems, and a mid-month update request means another two days of extraction. Between cycles, sponsors and leadership have no visibility, so decisions run on data that is weeks old. Newly acquired companies suddenly owe investor reporting that their finance function was never built to produce, and an operating executive can spend half their working hours on exports and lookups.
Every entity reports differently. Charts of accounts, periods, EBITDA definitions and file types all vary, so no two P&Ls can be compared as received.
A senior week disappears every month. An associate manually rebuilds 14 P&Ls into one view, and reconciliation errors go unnoticed because nobody has time to check.
The board pack takes days. Pulling ERP, CRM and operations data by hand costs three to four days, and a mid-month request costs two more.
Nobody can see between cycles. Sponsors decide on weeks-old data, and newly acquired companies owe investor reporting they cannot yet produce.
The Approach
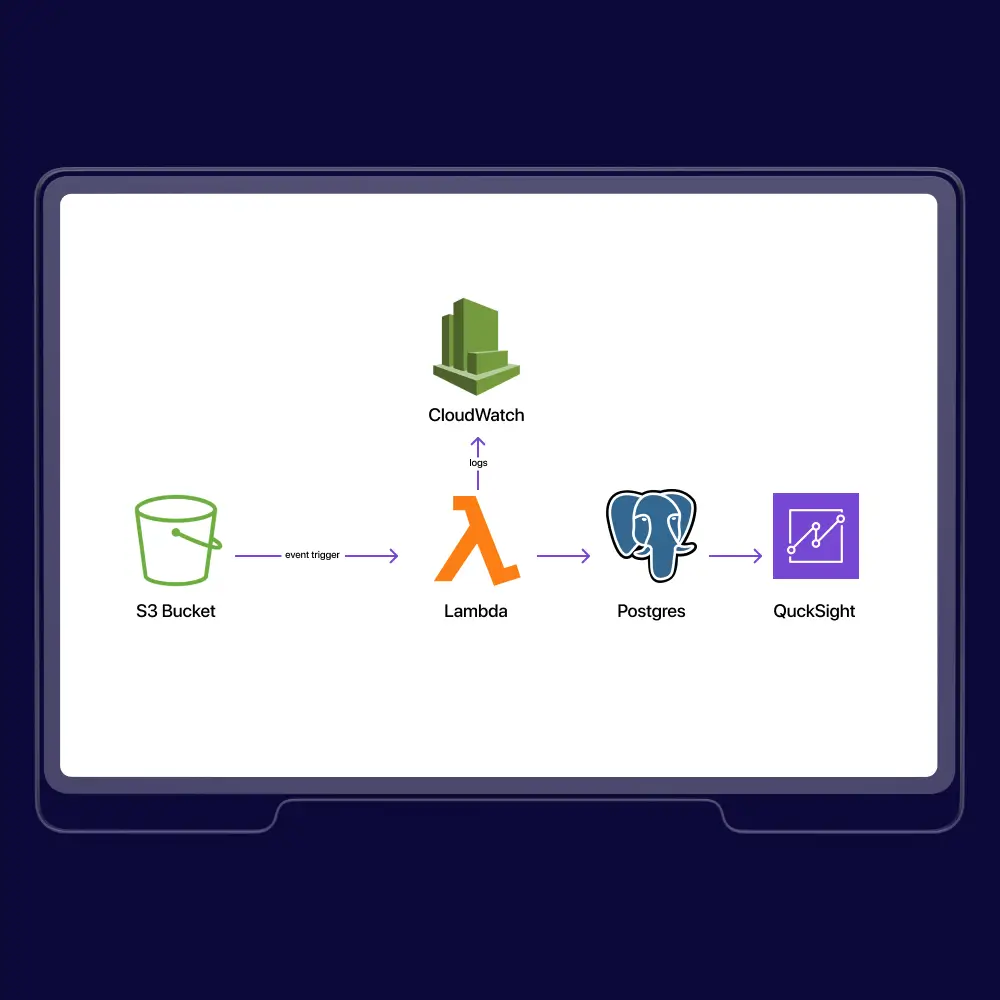
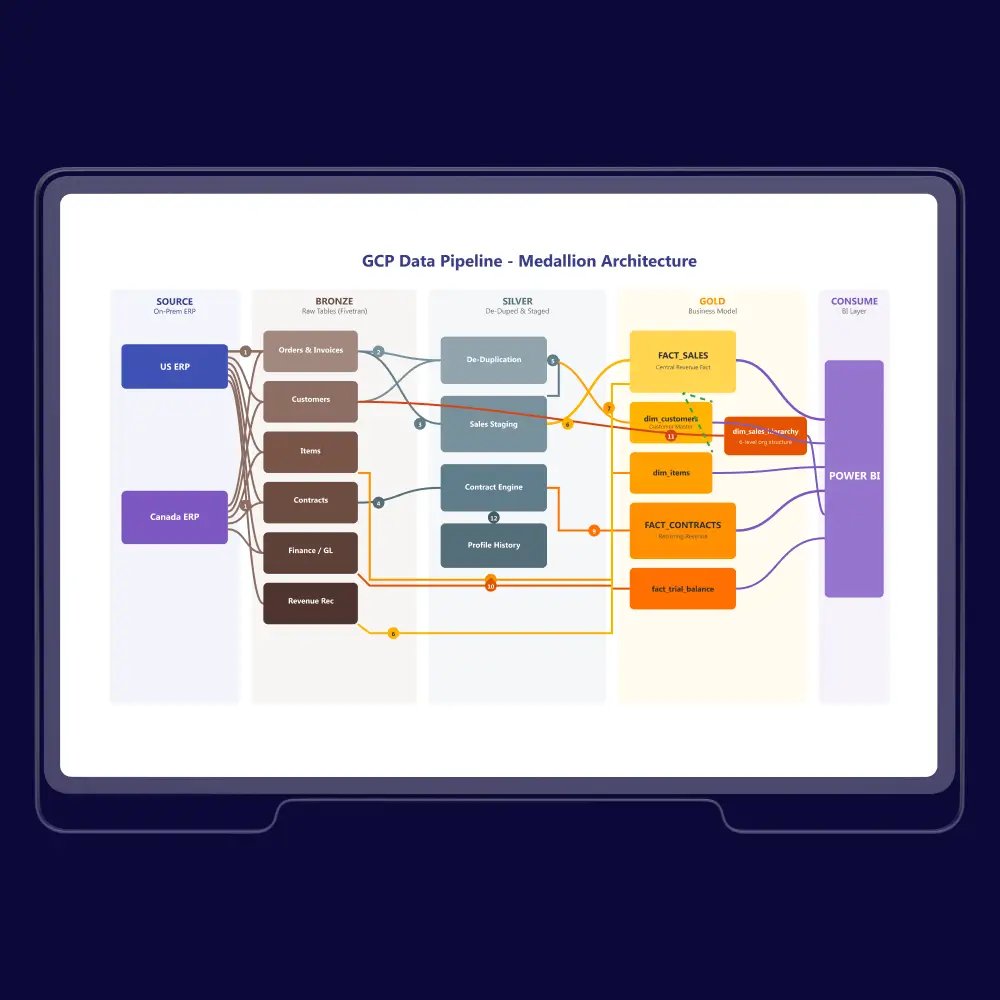
The layer sits on top of the existing process rather than replacing it. Portfolio companies simply email their financials as PDFs or spreadsheets, a document model parses them, and a second model maps every line item into a standardized P&L schema, with periods normalized and totals validated so errors surface for human review. Each month appends to a per-entity source of truth, so trends build up automatically with no template for the entity to fill in.
For board and management reporting, data integration from ERP, CRM and operational platforms feeds one unified model. Workflow automation assembles the board pack on schedule, and KPI alerts fire when performance deviates from plan, surfaced through a BI and analytics layer. Classical ML adds cash-flow and revenue forecasting where needed, and a natural-language query layer scoped by company and role lets leadership ask consolidated questions without an analyst in the loop. Most builds run on tools the client already owns, so there is no new procurement cycle.
Techniques: Document parsing and extraction · Standardized P&L schema mapping with total validation · Scheduled board-pack generation · KPI deviation alerts · Natural-language query with role-based access
AI role
AI extracts and structures inbound financial documents into a standardized schema, validates and flags anomalies, and answers natural-language questions across the consolidated dataset so non-technical stakeholders can query it directly.
Automation scope: Recurring, cross-entity financial consolidation, reconciliation and reporting for as many portfolio companies or business units as the firm holds.