
Choosing the right data science tools directly impacts your bottom line. Data scientists work 30% faster when they use integrated development environments. Standardized tools reduce the time spent on manual cleaning. This speed allows your team to deliver models to production in weeks instead of months. You can also schedule a call with us for the same thing.
What Does Data Science Do?
The big data science process is a systematic approach to solving the problem of gaining insights from analysis. It provides a structured framework for formulating a question, deciding how to solve it, and then presenting the solution to stakeholders. Another name for this process is the data science lifecycle. The terms can be widely used interchangeably, and both describe a workflow that starts with collection and ends with model deployment.
In turn, computer science encompasses both theoretical and practical aspects of computer technology, including designing, developing, and analyzing algorithms, programming languages, software, and hardware.
Data Science Strategic Tools
Choosing an analytics tool (desktop or cloud-based) is an important decision that will change the strategic implications for businesses for years to come. A data science tool that doesn't match the tasks and needs can confuse and prevent team members from revealing valuable information. And properly selected and "sharpened" tools help to get an idea about customers and products, and direct decision-making in the right direction.

Data Science Process Is a Plan of Action
Data science is a spiral on which each turn is a specific order of actions at a given level. After agreeing on the results, the process moves to the high level, and so on, until the project is completed successfully.
The sequence of actions is as follows:
- Discovery: Gathering complex figures from all established internal and external sources, including manipulation techniques. It can be:
- Logs from web servers
- Info from social networks
- Census results
- Data from online sources using an API.
- Preparation: Clear data from inconsistencies: missing values, empty columns, incorrect format. Before modeling, it is necessary to process, study, and prepare. The cleaner the results, the more accurate the predictions for data science.
- Modeldevelopment: Definition of a method and technique for building relationships between input variables. Model planning is performed using statistical formulas and visualization tools. SQL Analysis Services, R, and SAS/Access are used.
- Model building: The data scientist distributes sets of information for learning and testing. Techniques such as association, classification, and clustering are applied to the learning. The prepared model is checked on a "test" dataset.
- Deployment: Presentation of the final base model with reports, code, and technical documentation. The model is deployed to the production environment in real-time within data science.
- Communication: informing and exchanging opinions of stakeholders, whether the results of this stage of the project are successful, based on the model's input data.
High-quality communication with the customer is one of the key areas of all companies involved in data science, particularly DATAFOREST.
4 Important Questions
To choose the right tool for working with data science, you need to answer four questions:
- How does your company feel about data?
Knowing what you need from an analysis tool will help you formulate a list of requirements from a service provider. Knowing where the info is stored by cloud computing will answer the question, "Can this tool work with the data in its current state?" You may even find that the figures are unsuitable for answering business questions, even with the addition of an analysis tool. Poor quality or inaccessible numbers can limit opportunities.
- Who will use the data analysis tool?
Top executives, product managers, developers, marketers, and others rely on analytics to make department decisions. So, choose an analysis tool that can suit all needs and can integrate with their sources.
- What skills are required to use the tool?
Some companies may have scientists who can handle complex SQL queries and tools. But this is optional; you can additionally teach existing employees. And the best option would be a tool that is easy to use and open to accessing data.
- How important is data visualization?
Each analysis tool is capable of interpreting the data. The presentation of pins varies from platform to platform. A tool must deliver results in an easy-to-understand manner to ensure the business will reap the full benefits of the tool. The team will feel insecure when making decisions based on confusing graphs and charts.
The more reliable the analysis tools are, the better you can use insights for your business needs. Answers to difficult questions appear after a qualitative analysis of pure data.

Different Data Science Tools for a Common Purpose
Each step in advancing data science to insight for businesses requires separate tools. They differ in the way they work in the process. To collect info, web scraping or API exposure is needed; to store it, you need warehousing; and then, analysis, Machine Learning, and visualization. These are the shelves on which data science tools lie. And what exactly is required — to hammer in a nail or lay a tile — is up to the customer to decide.
No hit parades
You can search for "data science tools" and get many hit parade pages of the best, most popular, and newest tools. But the leading positions by name will not overlap. Because each author writes about their practice, and it appears in all its diversity when choosing the right tool. The tools below are sorted by their stage.
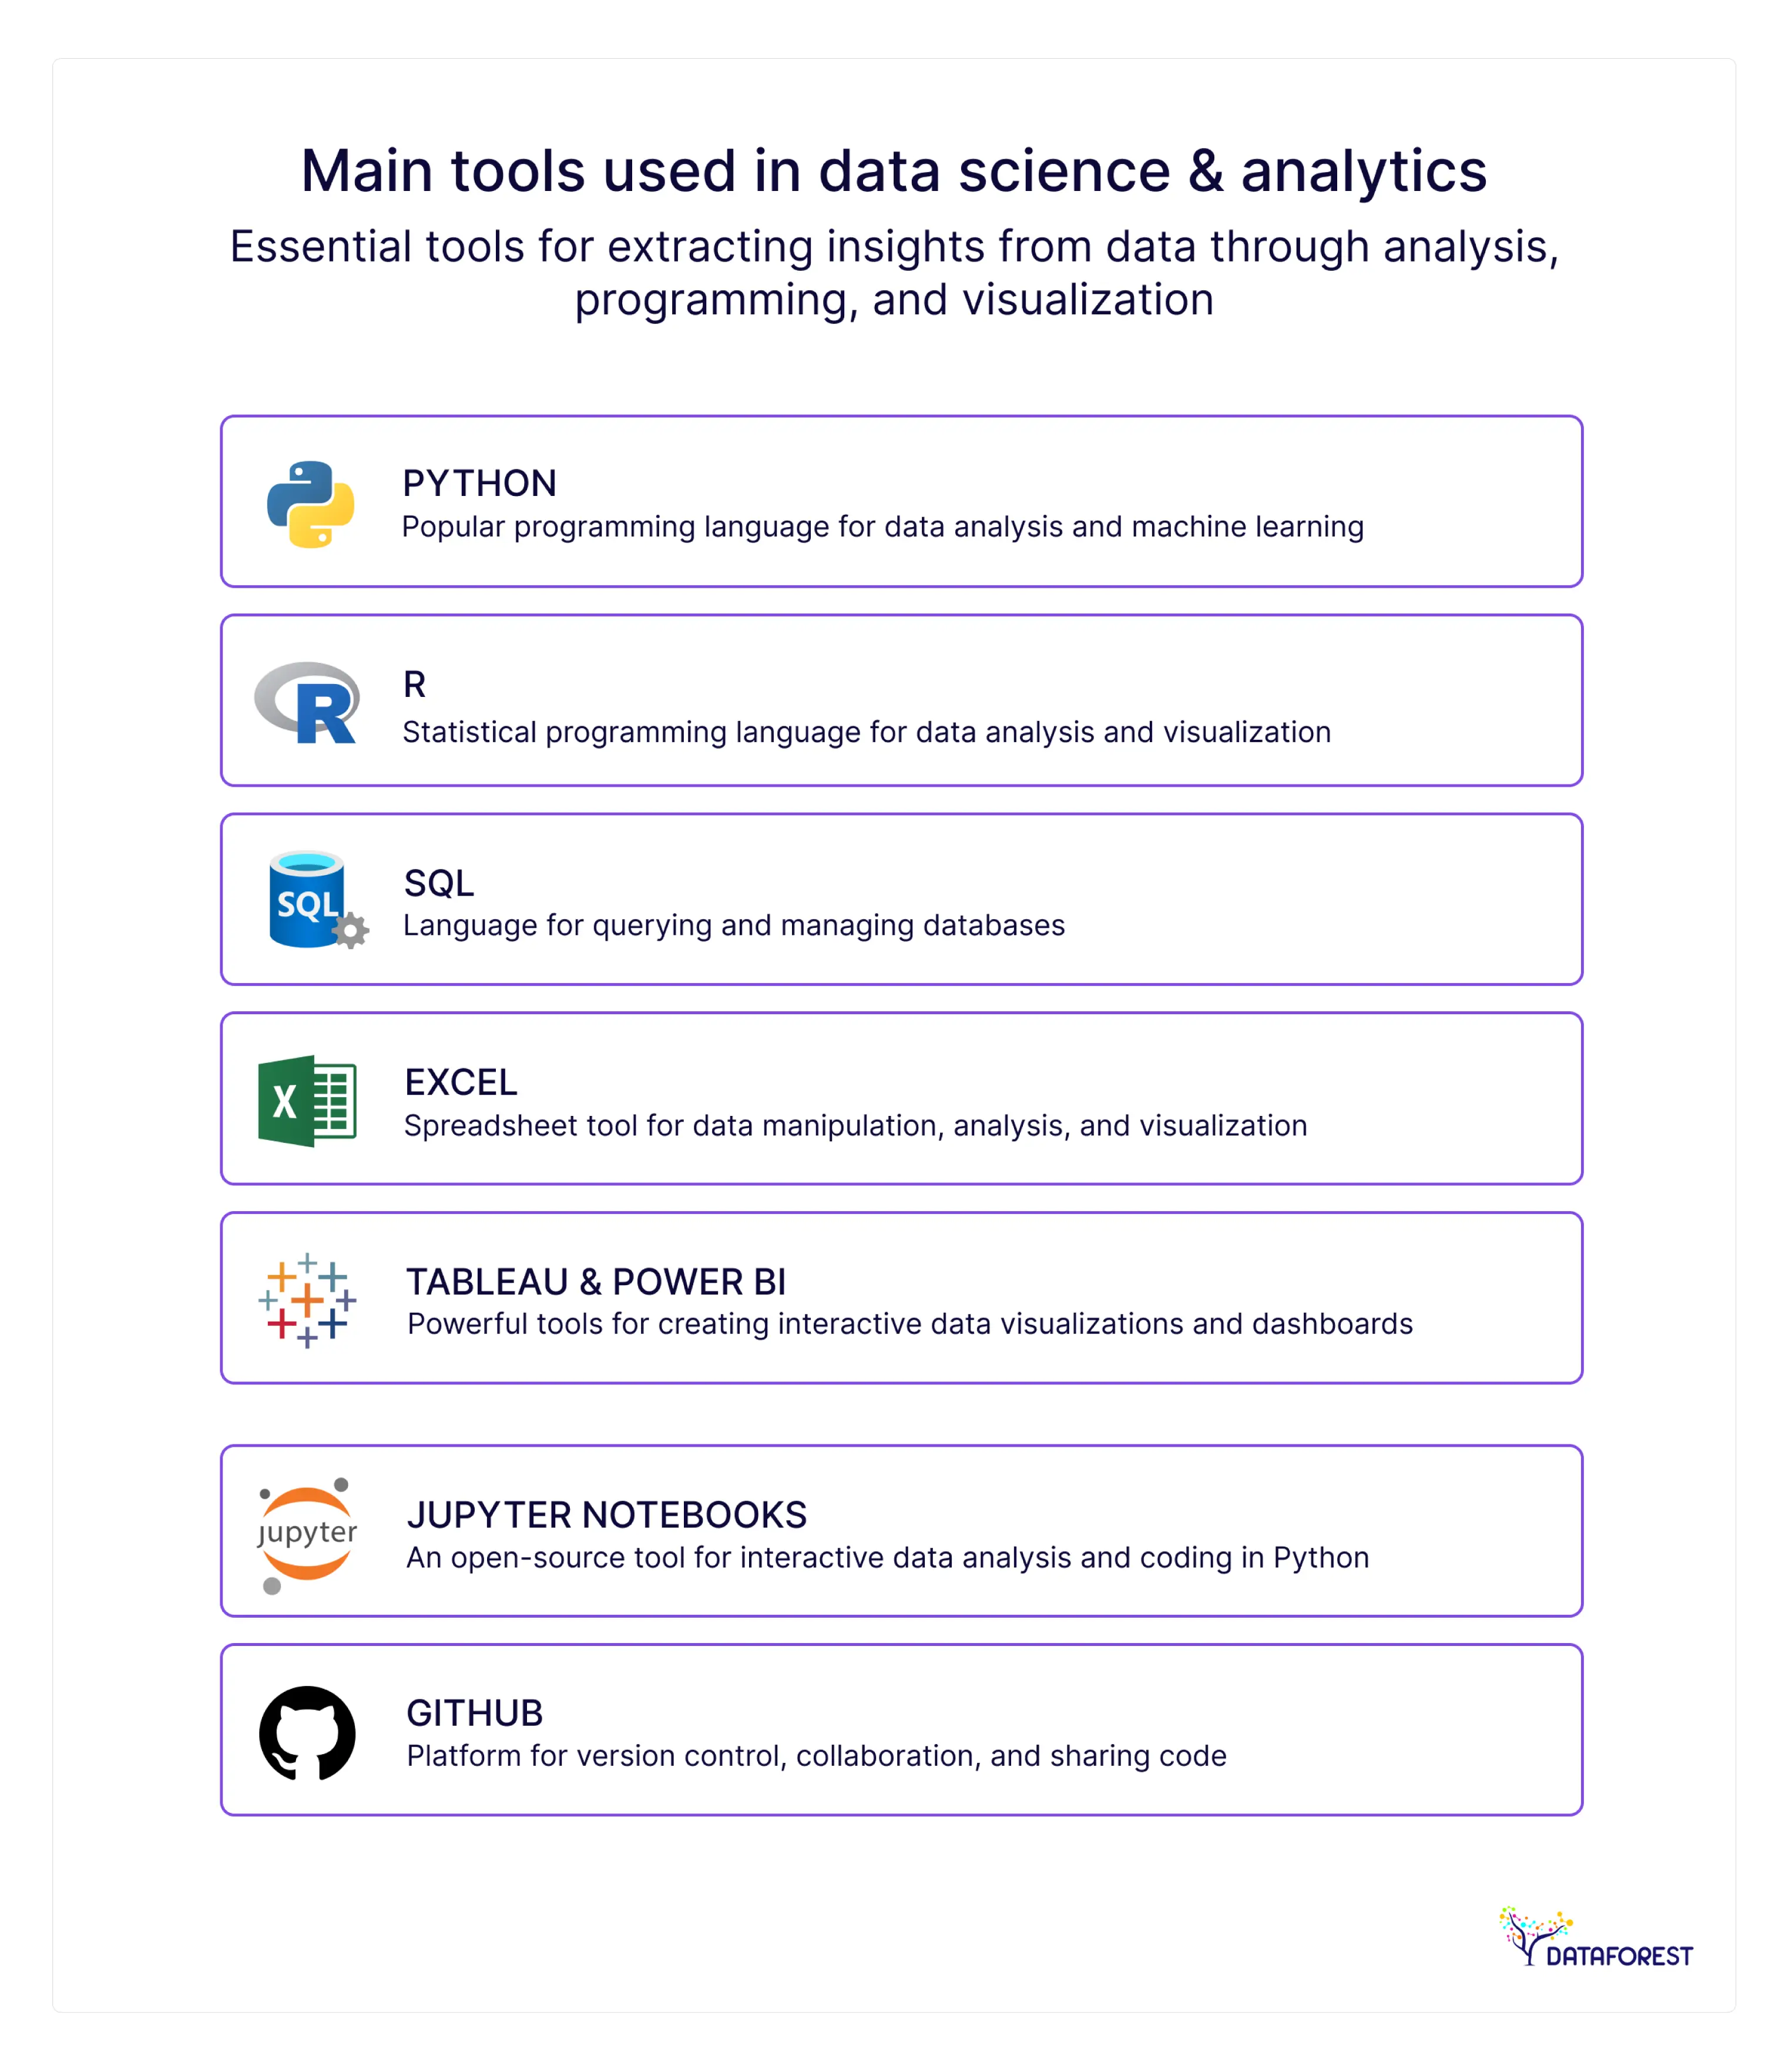
First of all, you need to decide on a programming language. According to the task, Python and the R Language are two equivalent options.
- Experienced programmers will take time to get used to R, while Python is more familiar, with a few exceptions.
- Python is closer to production and more often used in commercial projects. In academic circles, R is more popular.
- Upgrading your horizons in Machine Learning methods — you need R. If you are just getting acquainted with the most popular methods, Python has more opportunities.
- Python is better suited if the task is to implement development and programming something more complicated than predictors.
The choice of language also affects analysis tools.
Web scraping versus API data management is no longer such a thing — both data science tools can be used separately or together. The only difference is that the API technology is controlled by the website from which you want to get data. And web scraping does not require technical support from the site.
Visualization summarizes valuable information that the team might not find otherwise. Apache products are quantitatively leading against Amazon and Microsoft Azure in data warehousing.
Experts on Medium identify Python and SQL as the most important tools to master. Python handles the heavy math and machine learning tasks. SQL remains the standard for managing large databases. New cloud tools like Snowflake and Databricks are also top choices for 2026.
- Python: The universal language for data analysis and machine learning
- R: Advanced statistics and predictive modeling tool
- SQL: Structured query language for database management
- Tableau: Interactive data visualization and reporting tool
- Power BI: Microsoft’s analytics and reporting tool
- Apache Spark: Big data processing and analytics platform
- Jupyter Notebook: Interactive coding and documentation environment
- Git & GitHub: Version control and collaborative development
- TensorFlow & PyTorch: Deep learning and AI frameworks
- Excel & Power Query: Foundational tools for an analysis
Business intelligence (BI) is software that takes business information and presents it in user-friendly views such as charts, reports, dashboards, and graphs.
Difference Between Data Science with BI
Choose what is important to you and book a call.
Data Science at a Crossroads: Which Technique to Choose?
Methods, like data science tools, are best chosen for each case. But there is a list that most scientists use, and these techniques appear in most solutions.
- Classification is the sorting of statistics into groups or categories. The software is trained to identify and sort data. Known sets are used to build decision-making algorithms by a computer that quickly processes and classifies the data. Known data sets are used to build decision-making algorithms within modern data science tools that quickly process and classify the data.
- Regression is a method of finding relationships between unrelated points with the help of data science tools. Communication is usually modeled based on a mathematical formula and presented as a graph or curve. When the value of one point is known, regression is used to predict another point.
- Clustering is a data science technique that combines related patterns and looks for trends and anomalies. Clustering is different from classification because the data cannot be neatly classified into predefined patterns in data science tools. That is, the points are connected to the most similar parts. By using clustering features in data science tools, you can discover new patterns and relationships.
Scientists use computer systems and data science tools to track the progress of a process.
Insurance Profitability Analysis Tool


Great work! The team provided an excellent solution for consolidating our data from multiple sources and creating valuable insights for our business.
What to Look for When Choosing a Data Science Technique?
There are several factors that you should consider when selecting data science tools and techniques, including:
- Different data science techniques are better suited to specific types of problems. Classification techniques in data science tools are used when the goal is to assign points to predefined categories, while regression techniques in data science tools are used for problems where the goal is to predict a continuous value.
- The type and size of information you are working with will influence the suitable techniques. For example, deep learning capabilities within advanced data science tools may be more appropriate for image or speech data, while statistical methods inside lightweight data science tools may be better for small, structured datasets.
- The availability of tools and resources can impact your choice of data science techniques. For example, you may need to choose computationally efficient data science tools if you have limited access to computing resources.
- It is essential to consider the business goals and constraints of the project when choosing techniques. If the goal is to develop a predictive model that can be used in real time, you may need to choose optimized data science tools for speed and scalability.
- Your expertise and experience in data science will also influence your choice. If you have more experience with ML-focused data science tools than statistical platforms, you may be more likely to choose the former for a particular project.
It is important to carefully evaluate your options and choose data science techniques appropriate for your problem, data, and resources.

Two? Combinations of data science techniques
Different data science techniques can be combined to solve complex problems and gain deeper insights from data.
- Preprocessing and feature engineering with Machine Learning: Before building a Machine Learning model, statistics must be cleaned, transformed, and preprocessed. Additionally, feature engineering techniques supported by data science tools can be used to create new critical features from existing data, improving the model's performance.
- Exploratory analysis with visualization: Exploratory analysis involves examining and understanding the structure and patterns of the data. Visualization features in data science tools, such as scatter plots, histograms, and heat maps, help reveal patterns and relationships.
- Statistical analysis and hypothesis testing with Machine Learning: Statistical techniques integrated into data science tools can be used to make inferences about the test hypotheses. Machine Learning techniques can be used to build predictive data science tools based on the details and test the accuracy of the predictions.
- Deep learning with natural language processing: Deep learning techniques such as recurrent neural networks and convolutional neural networks can be combined with natural language processing techniques to build models that can analyze and generate human language.
- Ensemble learning with Machine Learning: Ensemble techniques available in advanced data science tools combine predictions of multiple models, improving overall accuracy and robustness.
The specific techniques and combinations of data science tools will depend on the problem and available data.
Examples of Good Data Science Technique Choices
Below are the top 5 companies that have successfully implemented data science techniques to improve their business operations:
- Amazon has successfully implemented data science techniques to improve its recommendation system. By analyzing data, Amazon can recommend products customers are more likely to buy, improving satisfaction and driving sales.
- Netflix has used data science techniques to improve its content system. By analyzing customer viewing history and preferences, Netflix is able to recommend shows and movies that customers enjoy, improving the UX and increasing engagement.
- By analyzing real-time info on ride demand and driver availability, Uber can adjust prices dynamically and match riders with drivers, improving efficiency and reducing wait time.
- Capital One: by analyzing transaction figures and identifying patterns and anomalies, the company is able to detect and prevent fraudulent transactions, improving the security and reliability of its services.
- By analyzing user queries and searches, Google can deliver more relevant and accurate search results, increasing the UX and improving user satisfaction.
These are just a few examples, and we suggest discussing your case with DATAFOREST.
Data science tools—driving profitable results
Best practices in data science lead to better results for your data projects. Experts build these rules from ten years of field testing. Teams update the steps when new code or tools appear. Clear rules help your staff build models that grow company profits.
Some key best practices
- It is essential to define clear and specific goals for the project, including the problem to be solved, the data to be used, and the expected outcomes.
- A structured approach, such as the Cross-Industry Standard Process for Data Mining methodology, can convince stakeholders to give launch consent.
- Ensuring quality and preparing the data for analysis is critical in any project. It includes cleaning, transforming, validating, and handling missing or inconsistent data.
- Exploratory analysis techniques can help to identify patterns and relationships in the statistics and guide subsequent analysis.
- Choose the most appropriate data science techniques based on the nature of the problem, type, and resources available. It may involve a combination of statistical, Machine Learning, and deep learning techniques.
-
- Model validation is a vital step to ensure that the models are accurate.
- Communication of the project results is vital to ensure stakeholders can understand and act on the insights gained from the analysis.
- Continuous improvement and iteration are important to refine and improve the models and insights over time.
Following these practices helps scientists ensure that their projects help deliver insights and value to the brand.
What exactly leads to success in data science?
Here are a few examples of how the best data science practices can help companies succeed:
- Data science helps companies to make better decisions by providing insights and recommendations based on data. A retail company may use customer information to identify patterns and trends in buying behavior and use this information to make more informed decisions about inventory and digital marketing strategies.
- By using data science techniques to analyze customer behavior and preferences, companies can tailor their products and services to meet the needs of their clients. A healthcare provider may use predictive analytics to identify patients at risk of developing chronic conditions and provide personalized care plans to improve outcomes and patient satisfaction.
- Companies that use data science effectively can gain a competitive advantage by making better decisions, improving operations, and providing a superior customer experience. A financial services company may use Machine Learning algorithms to identify fraudulent transactions more quickly than competitors, reducing losses and improving customer trust.
- Data science can also enable brands to develop new products and services and identify new revenue streams. A media company may use natural language processing techniques to analyze social media and identify trends, which can be used to develop new content and advertising strategies.
- Organizations can optimize their operations and reduce costs by using data science techniques such as predictive modeling and optimization. A manufacturing company may use predictive maintenance models to identify potential equipment failures before they occur, reducing downtime and maintenance costs.
Using science effectively gains insights, optimizes operations, and develops innovative solutions to drive success.
Eight tips for successful practice implementation
- Create a data-driven culture
- Focus on business outcomes
- Use a structured approach
- Ensure data quality and preparation of sets
- Select appropriate data science techniques
- Validate and iterate the model
- Communicate results effectively
- Invest in training and web development
DATAFOREST Can Help You Choose the Right Data Science Tools
DATAFOREST audits your existing infrastructure to identify bottlenecks and technical gaps. The team matches your specific business goals with the most efficient open-source or enterprise web frameworks. We build custom data pipelines that unify scattered sources into a single source of truth. The engineers ensure new data science tools integrate with your current systems without causing downtime. This strategic selection helps your company reduce cloud costs and speed up product releases.
Please complete the form to use the correct data science tools.
Questions on Data Science Tools
What are the considerations for selecting data science tools and techniques?
Selecting the appropriate data science tools and techniques requires careful consideration of several factors, including the problem domain, size, skill level, ability to perform data, compatibility, cost, and scalability.
How do I determine which programming language suits me best for a data science project?
Choosing a programming language requires careful consideration of several factors, including the nature of your data, available libraries and tools, skill level, industry preferences, and job market demand.
What is the difference between open-source and proprietary data science tools, and which should I choose?
Open-source tools can be a good option if you have a limited budget and are comfortable relying on community support. They are also an excellent tool for customization to fit your needs. Proprietary tools may be better if you require more robust customer support and more advanced features, or if security and privacy are a concern.
What visualization tools and techniques would you recommend?
The best visualization tool and technique will depend on your specific needs and the type you are working with. Choosing a tool and technique that effectively communicates your insights and engages your audience is important. Some famous (including open source software) visualization tools and techniques are Tableau, Python libraries, R ggplot2, D3.js, Geographic Information Systems software, and Infographics.
What are the popular statistical techniques and models used in data science?
Some of the most popular statistical techniques and models are Linear and Logistic Regression, Decision Trees, Random Forest, Support Vector Machines, Naive Bayes, K-Nearest Neighbors, Principal Component Analysis, Clustering, and Neural Networks.
How to understand which Machine Learning algorithm is more suitable?
It would be best if you considered the following: define the problem that you are trying to solve; collect the relevant figures and preprocess them; choose a subset of algorithms; split statistics into training and testing sets; train and evaluate models; choose the best algorithm.
What are the most effective methods of data cleaning and processing?
Effective cleaning and processing methods with positive use cases are: Handling Missing Data, Removing Duplicates, Transformation, Outlier Detection, Feature Engineering, Text Preprocessing, and Integration.
What must you know to choose the right data warehouse and management for a data science project?
There are several factors to consider in storage details when making this decision: volume and variety, structure, analytical requirements, integration with existing systems, cost, scalability and flexibility, and security and compliance. When processed with the right tools, data becomes more valuable.
How can I keep up with changes in various data science tools and techniques?
To keep up with changes in data science tools and techniques, you must: participate in online communities, attend conferences and meetups, read industry publications, take online courses and tutorials, and join online training programs.


%20(1).webp)