Core Data Science & Advanced Analysis Concepts
Data Science
Definition: Data Science is an interdisciplinary field that combines statistics, mathematics, programming, and domain expertise to extract knowledge, insights, and actionable value from structured and unstructured data. It is the practice of turning raw data into business intelligence, predictive models, and data-driven products that help organizations make better decisions, automate processes, and create competitive advantages.
Data science spans the full spectrum from descriptive analysis (understanding what happened) to predictive modeling (forecasting what will happen) and prescriptive analytics (recommending what to do) — making it one of the most strategically valuable capabilities a modern organization can build.
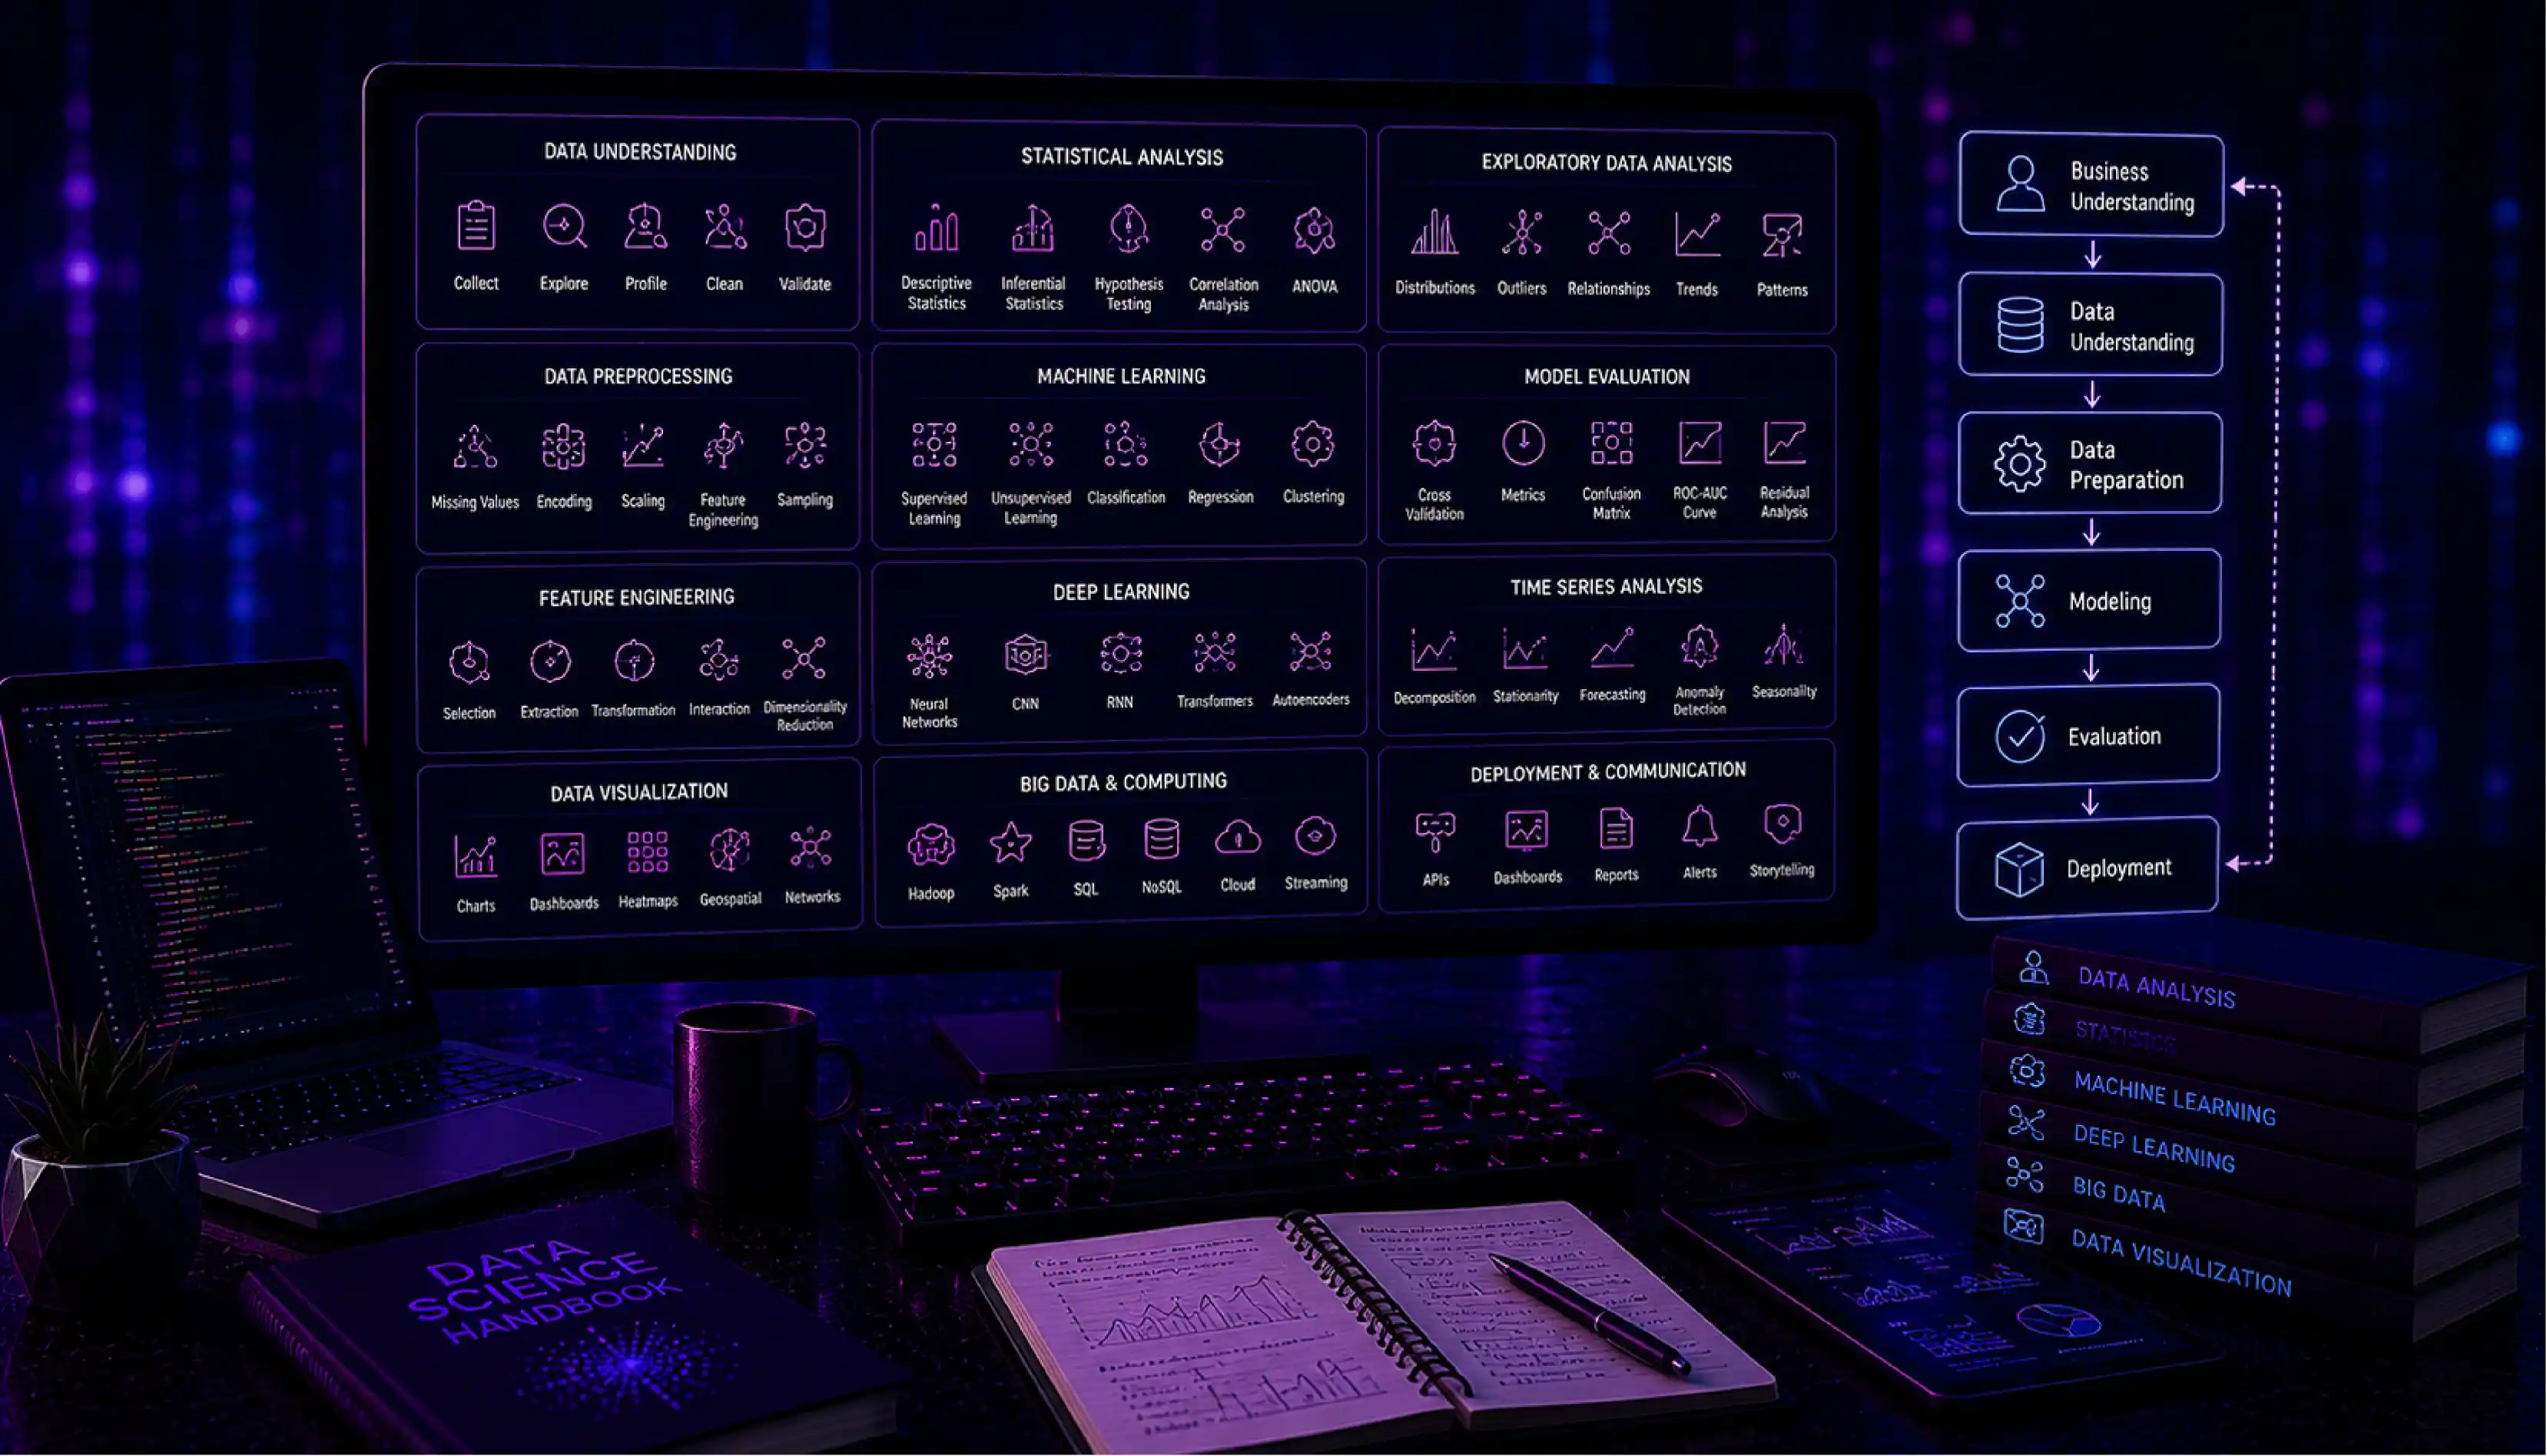
Technical Insight: The data science workflow covers: data collection and ingestion, exploratory data analysis (EDA), feature engineering, model selection and training, evaluation, and deployment. Core tools include Python (Pandas, NumPy, Scikit-learn, PyTorch, TensorFlow), R, SQL, and Jupyter Notebooks for interactive development. The field intersects with machine learning engineering (model building), data engineering (pipeline infrastructure), and analytics engineering (metric definitions). MLflow and DVC handle experiment tracking and data versioning; model serving is done via REST APIs (FastAPI, Flask) or managed data platforms (SageMaker, Vertex AI).
Data Science Pipeline
Definition: A Data Science Pipeline is the end-to-end sequence of steps that transforms raw data into a deployed, production-ready machine learning model or analytical output. It codifies and automates the data scientist's workflow — from ingesting and cleaning data, through feature engineering and model training, to evaluation, deployment, and ongoing monitoring — turning a one-time experimental process into a repeatable, maintainable production system.
For organizations, a formalized pipeline is the difference between a proof-of-concept model running in a Jupyter notebook and a reliable business asset — and a core deliverable of any data migration and modernization initiative.
Technical Insight: A production data science pipeline consists of: Data Ingestion (pulling from source systems), Data Validation (schema checks, distribution monitoring with Great Expectations), Preprocessing (transformations, encoding, scaling), Feature Engineering (creating model inputs), Model Training (hyperparameter search, cross-validation), Evaluation (offline metrics: AUC, RMSE, F1), Model Registry (versioning with MLflow or SageMaker Model Registry), Deployment (REST API, batch inference, or streaming), and Monitoring (data drift detection with Evidently AI, performance degradation alerts). Orchestration tools like Airflow, Prefect, or Kubeflow Pipelines automate the full sequence.
Statistical Analysis
Definition: Statistical Analysis is the process of collecting, organizing, interpreting, and presenting data using mathematical techniques to identify patterns, relationships, and trends, and to draw conclusions about populations from samples. It provides the rigorous, quantitative foundation for every data-driven decision — distinguishing genuine signals in data from random noise.
For businesses, statistical analysis answers the questions that intuition cannot reliably answer at scale: Does this marketing campaign actually increase conversion, or is the improvement just random variation? Is this product defect rate significantly higher than last quarter, or within normal fluctuation? Statistical methods make these determinations with defined levels of confidence.
Technical Insight: Statistical analysis is divided into Descriptive Statistics (summarizing data: mean, median, standard deviation, percentiles, histograms) and Inferential Statistics (drawing conclusions about populations from samples). Key inferential techniques include Hypothesis Testing (t-tests, chi-square tests, ANOVA — determining if observed differences are statistically significant), Confidence Intervals (quantifying estimation uncertainty), Correlation Analysis (Pearson, Spearman), and Regression Analysis (modeling relationships between variables). A/B testing is applied hypothesis testing. Tools: Python (SciPy, Statsmodels), R, and SQL window functions for in-database statistical computations.
Time Series Analysis
Definition: Time Series Analysis is the study of data points collected or recorded at successive, equally-spaced points in time — such as daily sales figures, hourly server metrics, monthly revenue, or stock prices — to understand underlying patterns, seasonality, and trends, and to forecast future values. Unlike cross-sectional data (a snapshot at one point in time), time series data has temporal structure: the order of observations matters, and each value is often correlated with previous values.
Businesses rely on time series analysis for demand forecasting (predicting inventory needs), financial planning (projecting quarterly revenue), anomaly detection (identifying unusual patterns in operational metrics), and capacity planning (predicting when infrastructure will need to scale).
Technical Insight: Time series decomposition separates a series into: Trend (long-term direction), Seasonality (repeating periodic patterns — weekly, monthly, yearly), Cyclical components (irregular business cycles), and Residuals (random noise). Classical models include ARIMA (AutoRegressive Integrated Moving Average — for stationary, univariate series), SARIMA (seasonal extension), and Exponential Smoothing (ETS). Modern approaches use machine learning: Facebook Prophet (decomposable model with holiday effects), LSTM networks (capturing long-range dependencies), and Temporal Fusion Transformers. Stationarity testing (Augmented Dickey-Fuller test) and differencing are prerequisite steps for classical models.
Trend Analysis
Definition: Trend Analysis is the process of examining data over time to identify consistent directional patterns — upward, downward, or cyclical movements — that reveal the underlying trajectory of a business metric, market condition, or phenomenon. It separates the signal (the true underlying direction) from noise (random short-term fluctuations) to provide a reliable basis for strategic forecasting and planning.
For business leaders, trend analysis transforms raw performance data into strategic foresight: recognizing that customer acquisition costs are trending upward over 12 months (not just volatile month-to-month) enables proactive investment in alternative channels before margins are eroded.
Technical Insight: Trend analysis techniques range from simple moving averages (SMA, EMA — smoothing short-term fluctuations to reveal direction) to linear regression trend lines (quantifying rate of change with statistical significance), polynomial regression (capturing non-linear trends), and LOESS/LOWESS (locally weighted smoothing for flexible trend estimation). In business intelligence, trend analysis is visualized as time-series charts with overlaid trend lines, period-over-period comparisons (YoY, MoM), and waterfall charts showing cumulative contributions to change. Breakpoint detection algorithms (PELT, BOCPD) identify structural shifts where the trend changes direction.

Exploratory Data Analysis (EDA)
Definition: Exploratory Data Analysis (EDA) is the critical first phase of any data science or analytics project — an open-ended investigation of a dataset to understand its structure, identify patterns and anomalies, check assumptions, and generate hypotheses before applying formal modeling. Rather than testing a predetermined hypothesis, EDA is discovery-driven: the analyst lets the data reveal its own stories.
EDA is where data quality issues are caught before they poison a model, where unexpected relationships between variables are discovered, and where the analytical approach is shaped by what the data actually contains — rather than what was assumed. Skipping EDA is one of the most common and costly mistakes in data science projects.
Technical Insight: EDA encompasses univariate analysis (distribution of each variable: histograms, box plots, QQ plots, summary statistics), bivariate analysis (relationships between pairs of variables: scatter plots, correlation matrices, cross-tabulations), and multivariate analysis (patterns across many variables: pair plots, heatmaps, dimensionality reduction visualizations). Data quality checks include: missing value analysis, duplicate detection, outlier identification (IQR, Z-score, isolation forest), and distribution shift detection. Python tools: Pandas-Profiling / ydata-profiling (automated EDA reports), Seaborn, Plotly, and Sweetviz. EDA findings directly inform feature engineering and model selection decisions.
Slice and Dice
Definition: Slice and Dice is a data analysis technique that involves breaking down a complex dataset into smaller, more focused subsets by filtering (slicing) along one dimension and subdividing (dicing) across multiple dimensions — allowing analysts to examine data from different angles to uncover patterns that aggregate-level views would conceal. The term comes from OLAP (Online Analytical Processing) and multidimensional data analysis.
For business analysts, slicing and dicing is the core daily workflow: starting with company-wide revenue, slicing by region to find a performance gap, then dicing by product category and sales channel within that region to pinpoint exactly which combination is underperforming — turning a vague concern into a specific, actionable finding.
Technical Insight: Slice and dice operations are performed on OLAP cubes (multidimensional data structures pre-aggregated for fast querying) or via SQL GROUP BY with multiple dimensions and HAVING filters. Modern implementations use: BI tool drill-down/drill-through functionality (Tableau, Power BI), SQL window functions with GROUPING SETS or ROLLUP/CUBE operators (computing subtotals across all dimension combinations in a single query), and columnar data warehouses (Snowflake, BigQuery) that execute these multi-dimensional aggregations at interactive speeds across billions of rows. The semantic layer ensures consistent dimension and metric definitions across all slicing operations- a principle central to any well-designed data architecture.
Principal Component Analysis (PCA)
Definition: Principal Component Analysis (PCA) is a dimensionality reduction technique that transforms a high-dimensional dataset into a smaller set of new variables — called principal components — that capture the maximum amount of variance in the original data. It identifies the most important 'directions' of variation in a dataset, discarding dimensions that contribute little information, while retaining the essence of the data in fewer dimensions.
For data scientists, PCA is essential when working with datasets that have hundreds or thousands of features: it reduces computational cost, removes multicollinearity between features, enables visualization of high-dimensional data in 2D/3D, and can improve model performance by eliminating noise dimensions.
Technical Insight: PCA works by computing the covariance matrix of the feature set, then performing eigendecomposition to find eigenvectors (principal components — orthogonal directions of maximum variance) and eigenvalues (the amount of variance each component explains). Components are ordered by explained variance ratio; analysts retain enough components to explain 90-95% of total variance (the 'elbow method' on a scree plot). PCA requires feature standardization (zero mean, unit variance) before application. Related techniques: Kernel PCA (non-linear dimensionality reduction), t-SNE and UMAP (non-linear, optimized for visualization), and Sparse PCA (interpretable components). Implemented in Scikit-learn's sklearn.decomposition.PCA.
Feature Engineering
Definition: Feature Engineering is the process of using domain knowledge and data manipulation to create, transform, or select the input variables (features) that a machine learning model will use to learn from — with the goal of improving model performance and predictive accuracy. Raw data rarely arrives in a format that machine learning algorithms can directly exploit optimally; feature engineering bridges that gap.
Among experienced data scientists, feature engineering is widely considered the single most impactful step in the ML pipeline: a well-engineered feature set can make a simple model dramatically outperform a sophisticated one trained on poorly processed raw data. It is where domain expertise translates into machine learning value.
Technical Insight: Feature engineering techniques include: Numerical transformations (log transformation to reduce skewness, polynomial features to capture non-linear relationships, binning continuous variables into categories), Categorical encoding (One-Hot, Target Encoding, Embeddings for high-cardinality), Temporal features (extracting day-of-week, hour, month, time since last event from timestamps), Interaction features (multiplying or combining two features to capture joint effects), Aggregation features (rolling means, counts, sums over time windows), and Text features (TF-IDF, word embeddings). Automated feature engineering tools (Featuretools, AutoFeat) use deep feature synthesis to generate hundreds of candidate features from relational data. Feature selection (RFE, SHAP importance, correlation filtering) then removes redundant or harmful features.
Model Evaluation
Definition: Model Evaluation is the systematic process of measuring how well a machine learning model performs — assessing its accuracy, reliability, and suitability for deployment using quantitative metrics and validation techniques. It answers the critical questions: Does this model actually work? Will it generalize to new, unseen data? Is it good enough for the business problem it is solving? And is it better than the alternatives?
Rigorous model evaluation is what separates responsible ML engineering from dangerous guesswork. A model that looks impressive on training data but fails on real-world data — a phenomenon called overfitting — can cause significant business harm if deployed without proper evaluation.
Technical Insight: Evaluation metrics are task-specific: for Classification — Accuracy, Precision, Recall, F1-score, AUC-ROC (measuring discrimination ability across thresholds), and Confusion Matrix; for Regression — MAE (Mean Absolute Error), RMSE (Root Mean Squared Error), MAPE, and R-squared; for Ranking — NDCG, MAP. Validation strategies include: Hold-out split (simple train/test division), K-Fold Cross-Validation (averaging performance across K folds for robust estimation), Stratified K-Fold (preserving class balance in each fold), and Time-Series Cross-Validation (walk-forward validation respecting temporal order). Overfitting is diagnosed by the gap between training and validation metrics; addressed via regularization (L1/L2), dropout, early stopping, or more training data.


Advanced Data Analysis: The Complete Data Science Glossary
Share
Table of contents:
80%+ Reduction in Manual Job Data Handling Using an AI Platform
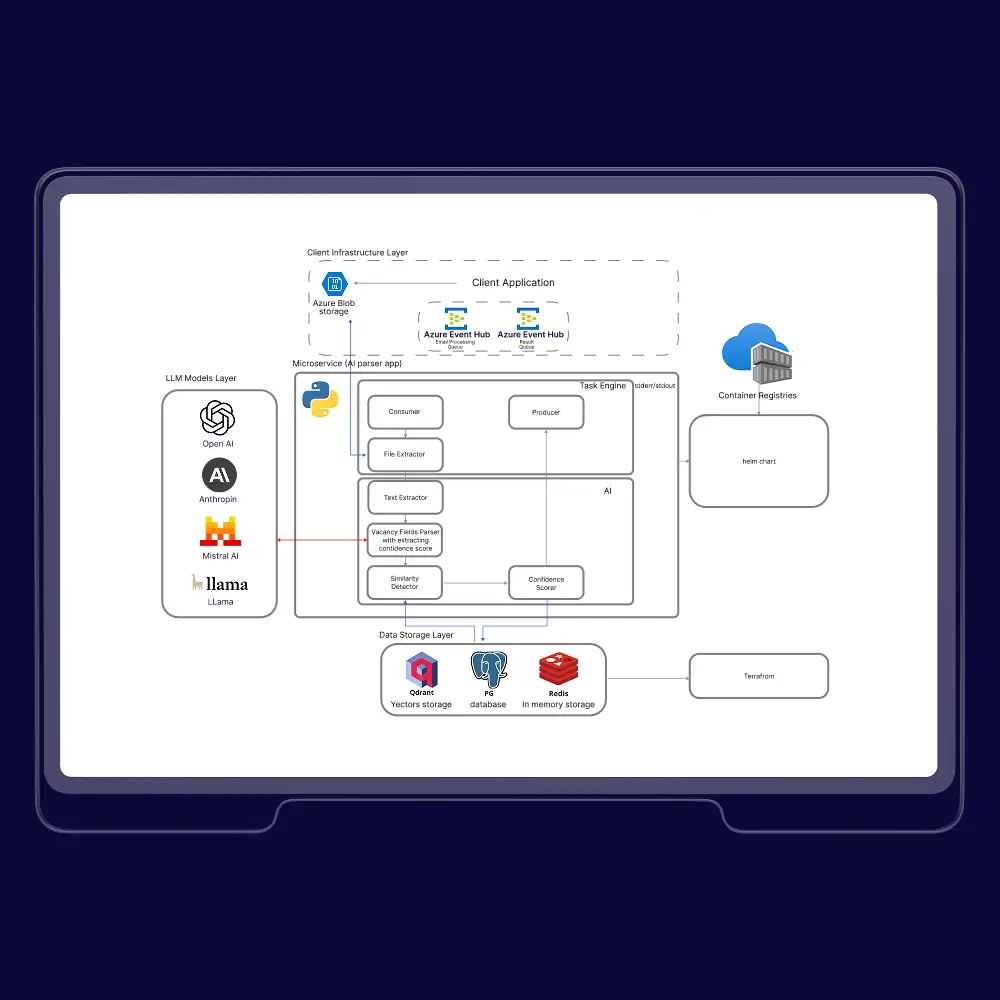

Cut Manual Data processing with an AI Platform
Podcast Platform Boosts Engagement 7× Using AI Recommendations
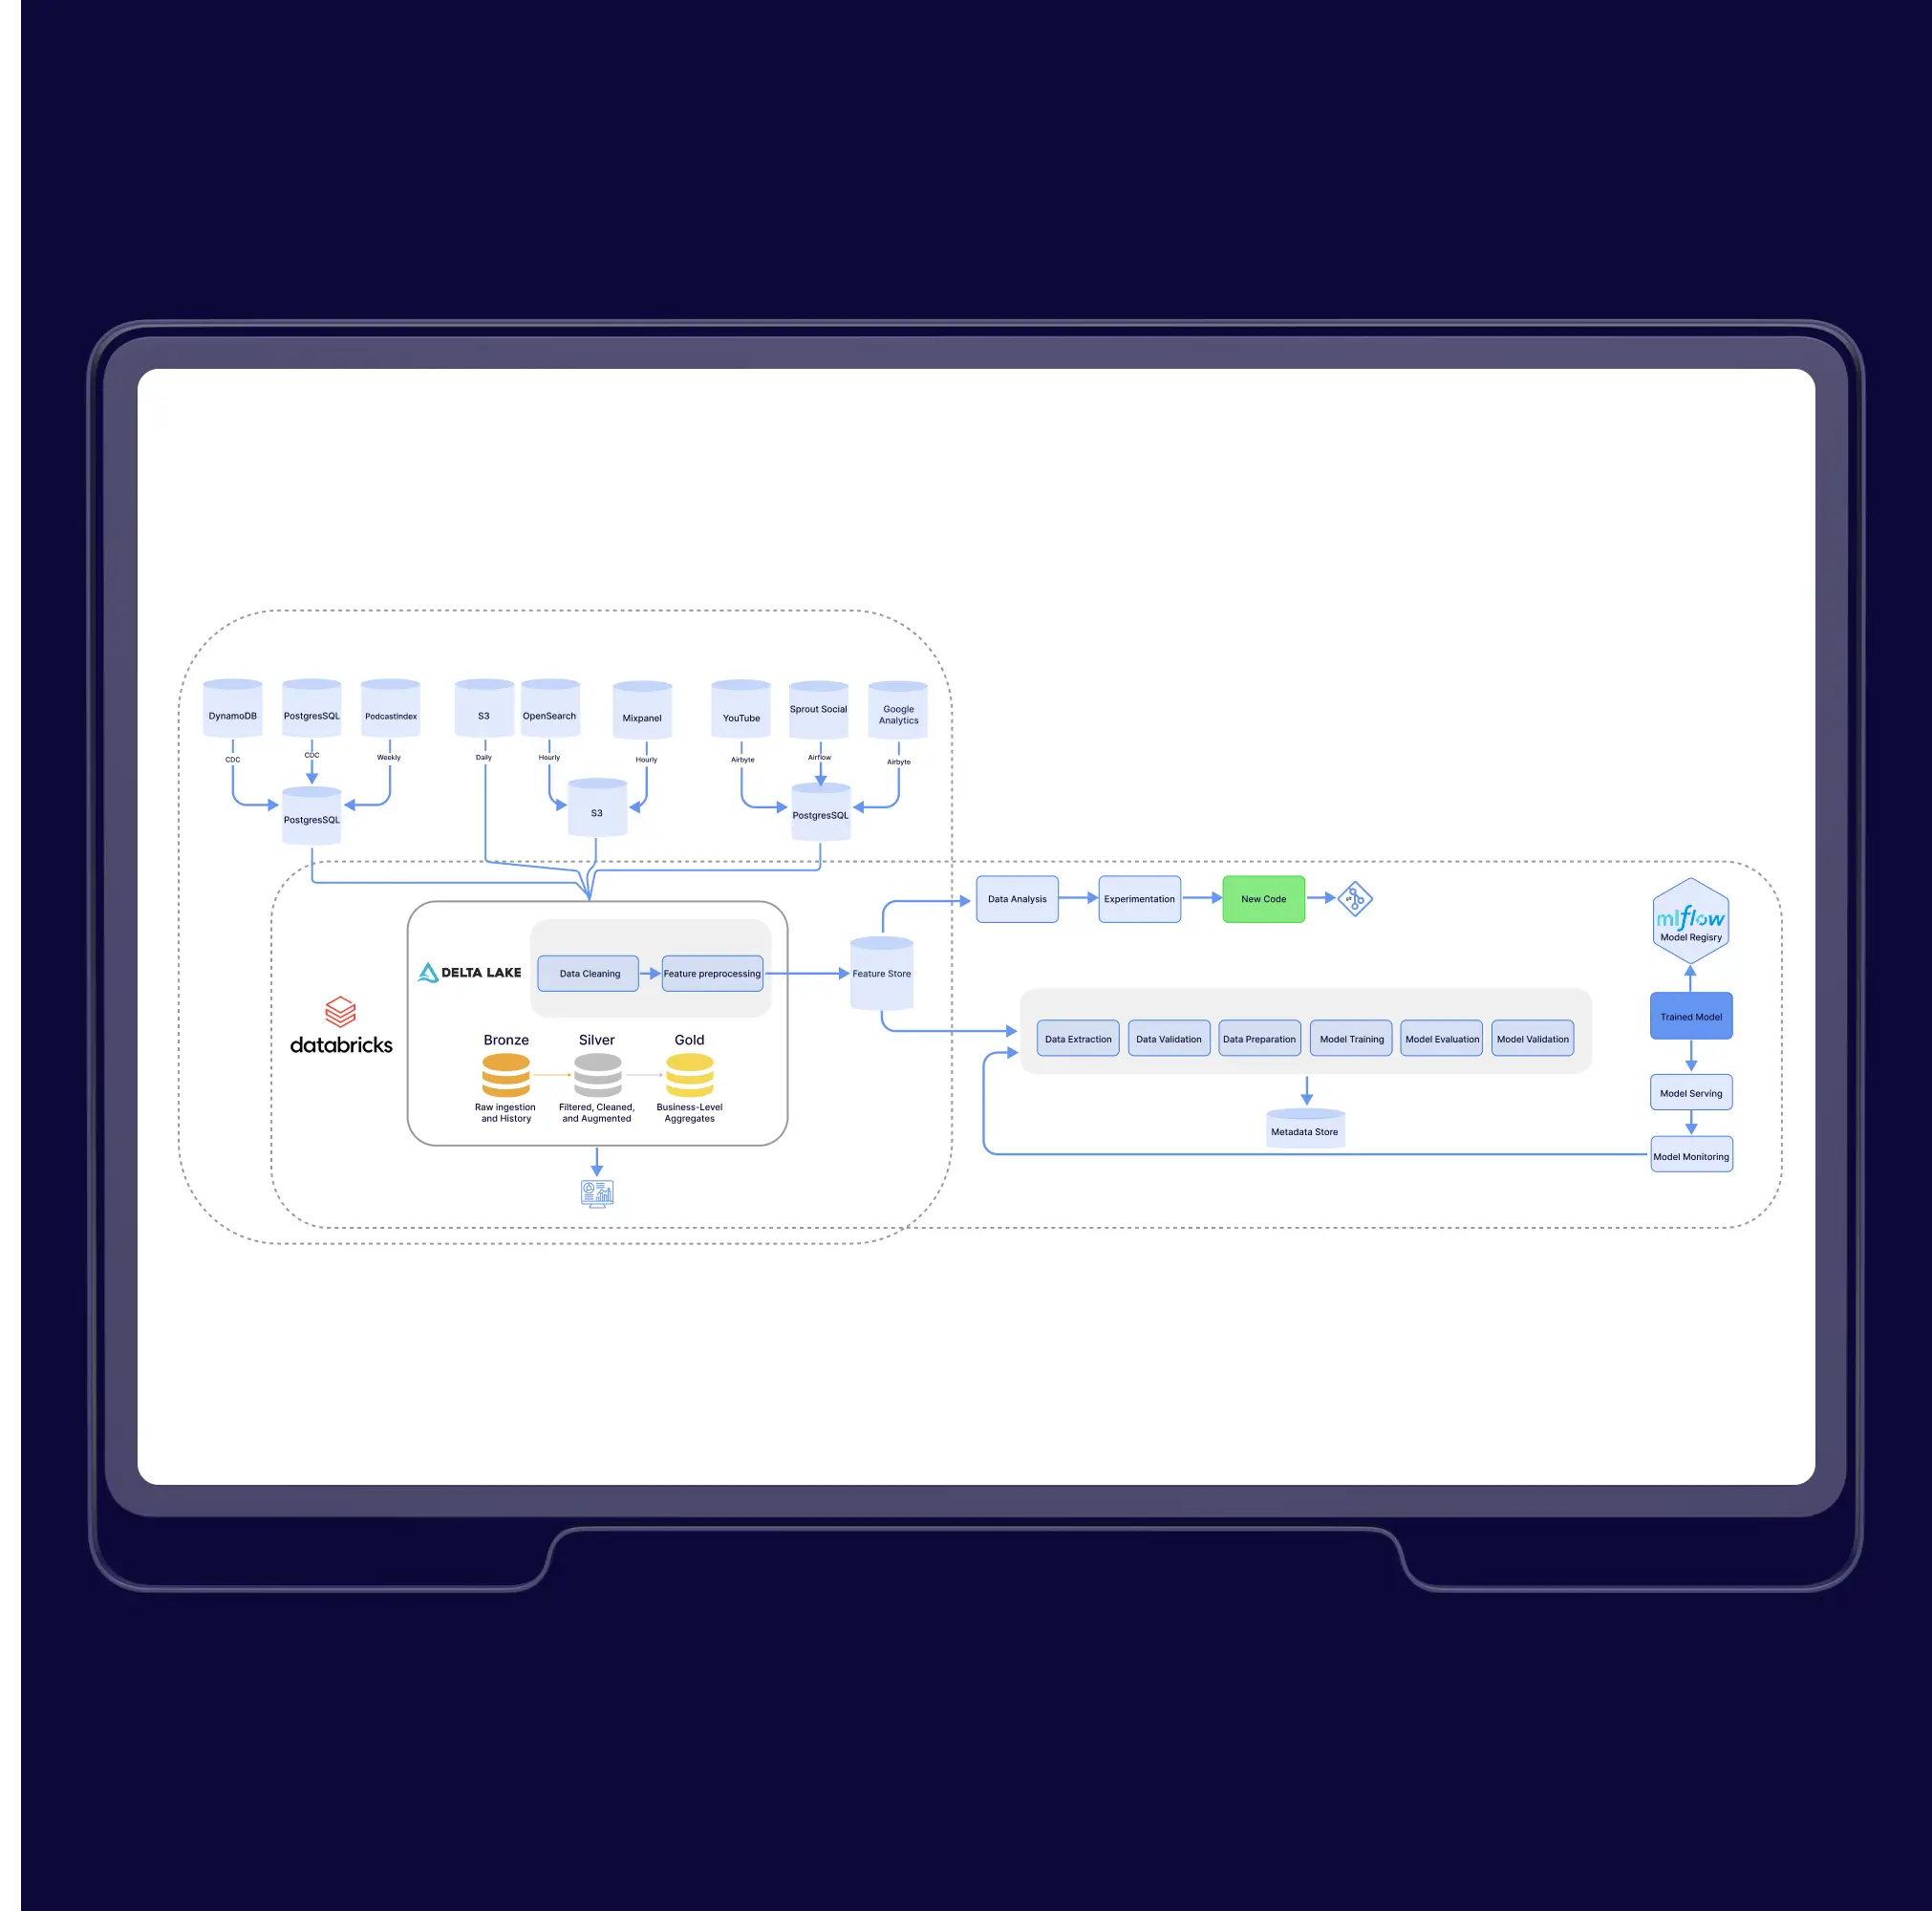
Podcast Platform Boosts Engagement 7× Using AI Recommendations
Insurance Profitability Analysis Tool


Great work! The team provided an excellent solution for consolidating our data from multiple sources and creating valuable insights for our business.
Latest publications
All publications
Data Science Made Simple
.webp)
Data Science Algorithms: Instructions to Solve a Problem