


The same survey produced two contradictory findings: 63% of business leaders describe their organization as data-driven, while 63% of technical leaders say their companies struggle to drive business priorities with data. Same survey. Opposite experiences.
That gap is not a measurement error. It is the central problem with most business intelligence strategies: they look complete on paper but fall apart in practice. Dashboards get built. Reports get scheduled. And then, quietly, nobody opens them.
The failure is rarely technical. Teams choose capable tools, connect real data sources, and produce accurate outputs. What they skip is the harder work: aligning BI goals to actual decisions, earning trust in the data before asking people to act on it, and designing for the person who needs an answer at 9 a.m. on a Tuesday—not for the analyst who built the model.
This guide covers how to assess your current BI maturity, establish data governance before you build anything, work through a seven-step strategy roadmap, select tools that fit your context, and measure whether the program is actually working. The focus throughout is adoption—because a BI strategy that sits unused is not a strategy. It is an expensive report.
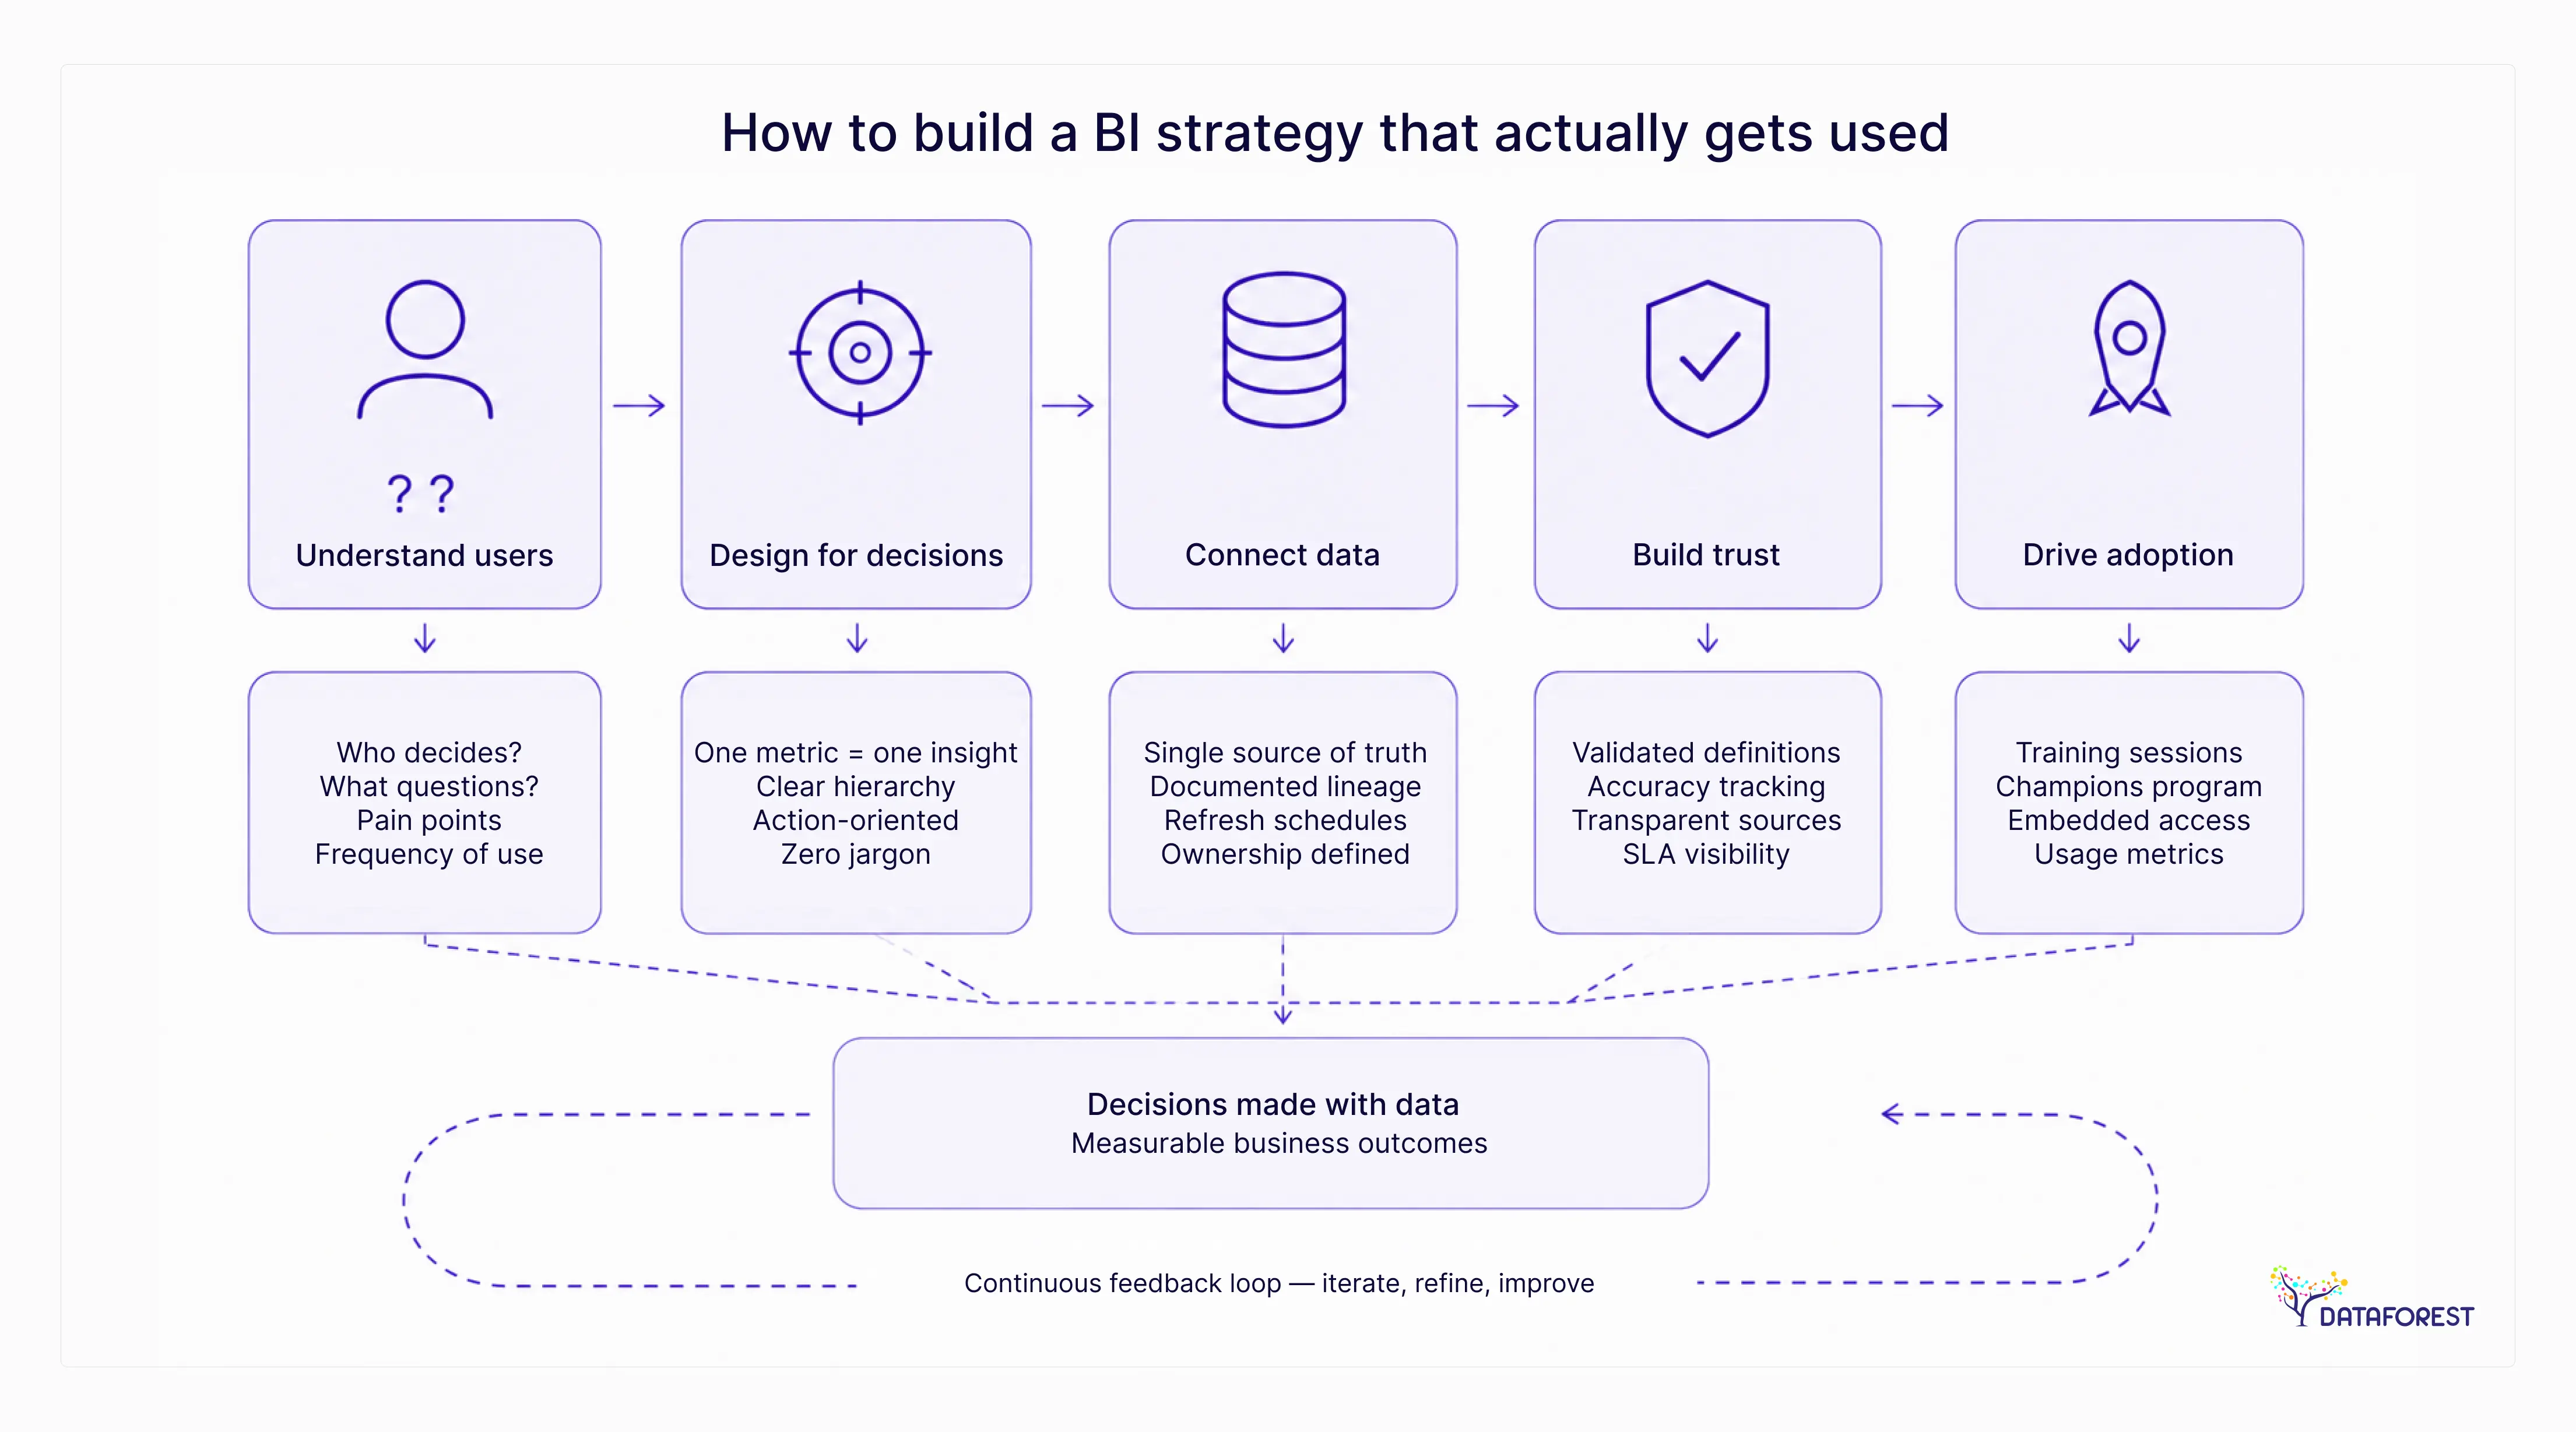
Key Takeaways
- 63% of business leaders call their organization data-driven, yet 63% of technical leaders admit their companies struggle to act on data (Salesforce State of Data Analytics Report)—see The Adoption Paradox.
- BI that adds friction gets routed around. When data is fragmented or low quality, it slows decision-making and weakens data-driven workflows, so analytics has to live inside the work, not beside it.
- Buying a platform without investing in people leaves value on the table. Real impact comes when teams are upskilled, workflows are redesigned, and the operating model turns data into faster decisions and measurable results.
- Modern BI tools can remove dashboard and SQL bottlenecks, helping teams get faster insights and make decisions in the flow of work. In a 2025 Microsoft customer story, Bank CenterCredit cut analytics time and accelerated decision-making by 50% after deploying Microsoft Fabric and Power BI.
- BI programs usually fail at the operating-model layer, not the dashboard layer. Success starts with clear goals, decision rights, governance, and team capabilities before the first report is built.
The Adoption Paradox: Why Most BI Strategies Sit Unused
Most BI programs share the same contradiction: organizations invest heavily in data infrastructure, build dashboards, and declare themselves data-driven—then watch those dashboards collect dust.
The gap between data ambition and data reality
According to Salesforce's State of Data Analytics Report, 63% of business leaders define their organization as "data-driven," up 10% from 2023. That number sounds like progress. But in the same report, 63% of technical leaders surveyed acknowledge that their companies struggle to drive business priorities with data. Both statistics are true simultaneously. That is the paradox.
Organizations are not short on data ambition. They are short on the conditions that make data usable.
Why dashboards get built but not opened
The pattern is consistent: a BI team builds a reporting layer that answers the questions they thought were important, not the questions decision-makers actually ask on a Tuesday morning. The result is a technically correct dashboard that no one trusts, understands, or opens.
The problem compounds when BI is positioned as an IT deliverable rather than a business tool. When analysts own the output but managers own the decisions, the two rarely meet.
What actually gets used requires from the start.
Stop treating adoption as a change management problem you solve after launch. It is a design requirement you embed from day one.
BI that adds friction gets routed around. When data is fragmented or low quality, it slows decision-making and weakens data-driven workflows, so analytics has to live inside the work, not beside it.
A BI strategy that gets used starts with the workflows people already run - and makes data the path of least resistance inside those workflows, not a detour away from them.
What Is a Business Intelligence Strategy?
A business intelligence strategy is a formal plan that defines how an organization will collect, manage, and use data to support decisions. It specifies which business questions matter most, who owns the answers, and what infrastructure and processes will deliver them reliably. A BI strategy is not a list of tools—it is a governance and prioritization framework that makes tools useful.
BI strategy vs. BI tactics: a practical distinction
The confusion between strategy and tactics is where most BI programs go wrong. Strategy answers why and what: which decisions need better data, which teams are the primary consumers, and what success looks like in measurable terms. Tactics answer how: which dashboard to build next, which ETL pipeline to configure, which report to automate.
Here is the practical distinction in concrete terms:
Teams that skip the strategy layer and jump straight to tactics end up with dashboards that answer questions nobody asked. That pattern is the root cause of the adoption failure described in the previous section.
What a BI strategy is not
A BI strategy is not a software procurement plan. Buying a new platform is a tactic. A BI strategy is also not a data strategy, though the two are related. And it is not a one-time document—it requires a review cadence as business priorities shift.
Deloitte’s 2025 tech value survey of nearly 550 leaders across five industries draws on four years of research, leveraging longitudinal data, cluster analysis, and predictive modeling to reveal distinct patterns in technology spending and value realization.
BI strategy vs. data strategy: where they overlap and where they diverge
A data strategy governs the entire data lifecycle—collection, storage, quality, privacy, and long-term architecture.Successful data platform development supports these capabilities by creating a scalable environment for governance, analytics, and business intelligence initiatives. A business intelligence strategy is narrower: it focuses specifically on how business users turn data into decisions.
They overlap on data governance and data quality, because BI cannot function on unreliable data. They diverge in scope: data strategy includes data products, machine learning pipelines, and regulatory compliance, none of which have anything to do with a BI dashboard. Build your data strategy first; your BI strategy sits inside it.

The Business Case for BI Investment: ROI Before You Build
Building a BI strategy without a business case is how you end up with a dashboard nobody opens and a budget that doesn't survive the next planning cycle. Before you write a single requirement, you need numbers your CFO will recognize.
Quantifying the upside: what data-driven organizations actually achieve
The McKinsey Global Institute found that data-driven organizations are 23 times more likely to acquire customers, six times more likely to retain them, and 19 times more likely to be profitable. That's not a marginal edge—it's a structural one. The gap between organizations that use BI well and those that don't compounds over time.
The capability side matters just as much as the technology side. Organizations with skilled BI teams are 3x more likely to achieve their data-driven goals (Folio3 Data BI Strategy Analysis). Buying a platform without investing in the people who use it is one of the most reliable ways to waste the budget. And on the speed dimension: companies using modern BI tools report a 50% faster time to insights than traditional reporting methods (Folio3 Data BI Strategy Analysis)—which translates directly to faster decisions, shorter planning cycles, and fewer missed windows.
A simple BI ROI calculation framework
Use this table to structure your internal cost-benefit estimate. Fill in the "Example Metric" column with your organization's actual figures before presenting to stakeholders.
Keep the cost rows honest—implementation and change management routinely exceed licensing costs in the first year. Underestimating them is how BI projects lose executive confidence mid-build.
How to present the business case internally
Stop leading with technology. Executives don't fund platforms—they fund outcomes. Frame your case around a specific decision that currently takes too long or produces inconsistent answers, then show what faster or more reliable data would change about that decision.
Three elements make an internal BI business case land: a named problem with a quantifiable cost, a realistic estimate of the changes that will occur with BI in place, and a clear owner accountable for the outcome. If you can't name all three, the case isn't ready.
Assess Your BI Maturity Before You Build Anything
Building a BI strategy on top of an immature data infrastructure is like designing a highway before you've paved the roads. The most common reason BI programs stall isn't a bad strategy document—it's a mismatch between strategic ambition and organizational readiness.
The 5-level BI Maturity Model explained
The BI Maturity Model describes how organizations progress from ad hoc, reactive reporting toward fully integrated, decision-driven analytics. Most frameworks describe five levels:
- Level 1—Reactive: Data lives in spreadsheets and siloed systems. Reports are built on request, often manually.
- Level 2—Developing: Some centralized data infrastructure exists. Basic dashboards are deployed but inconsistently used.
- Level 3—Defined: Governance policies are in place. BI tools are standardized, and adoption is growing across teams.
- Level 4—Managed: Analytics are embedded in workflows. KPIs are tracked systematically and tied to business outcomes.
- Level 5—Optimized: Predictive and prescriptive analytics inform decisions in real time. BI is a competitive capability, not just a reporting function.
Most mid-market organizations sit between Levels 2 and 3. Knowing your level tells you where to start—not where you wish you were.
BI Maturity Self-Assessment: score your organization across 5 dimensions
Score each dimension honestly. Circle the description that best matches your current state, then total your points.
Maturity Score Interpretation:
- 5-8 pts: Reactive—prioritize data infrastructure and governance before strategy
- 9-12 pts: Developing—build the roadmap with governance guardrails
- 13-15 pts: Optimized—focus on self-service expansion and meta-KPI tracking
How your maturity score shapes your strategy
Your score is not a grade—it's a starting point. Reactive organizations that skip straight to dashboard deployment almost always end up back at square one within a year. Developing organizations need a roadmap with built-in governance guardrails from the start, not bolted on later. Optimized organizations face a different problem: sustaining adoption and expanding analytical capability without creating governance debt.
Before you move to the roadmap in the next section, run through this pre-launch checklist. If you can't check every item, address the gaps first.
Pre-Launch Adoption Checklist:
- Business objectives are documented and linked to BI outputs
- Data governance prerequisites are confirmed complete
- At least one executive sponsor is named and committed
- End users were consulted during tool and dashboard design
- BI Adoption Health Scorecard baselines are set
For reference, here is how BI strategy decisions differ from BI tactics—a distinction that matters most when you're deciding what your maturity score should actually change:
Data Governance: The Prerequisite Nobody Talks About
Most BI programs fail not because they chose the wrong tool, but because they built on top of data nobody trusts. Governance is the foundation—and skipping it means your dashboards will be questioned, ignored, or actively undermined by the people you built them for.
Why governance must come before dashboards, not after
The pattern is predictable: a team launches a dashboard, two departments pull the same metric and get different numbers, and the resulting argument kills adoption faster than any UX problem ever could. Retrofitting governance after deployment is far harder than establishing it first. Definitions get locked into reports, pipelines get built around bad assumptions, and changing them later requires renegotiating with every downstream consumer.
Governance does not mean a formal data council with quarterly meetings. At minimum, it means answering three questions before you build anything: Who owns this data? What is the authoritative version? And what counts as a valid record? Those three answers prevent the arguments that kill adoption.
The 5-item data readiness checklist
Before your team proceeds to strategy design or tool selection, confirm each item below. If you cannot check all five, address the gaps first—they will surface as adoption problems later.
Data Readiness Checklist
- Data ownership is assigned for every critical data domain
- A single source of truth is documented for key metrics
- Data quality standards and validation rules are defined
- Access controls and data classification policies exist
- A data dictionary or glossary is maintained and accessible
This checklist is part of the Pre-Strategy Assessment framework, which also covers stakeholder mapping, data audit, and goal alignment. Treat it as a gate, not a guideline.
Assigning data ownership and a single source of truth
Data ownership is a human problem, not a technical one. Every critical domain—revenue, customer, product, operations—needs a named owner who is accountable for quality and responsible for resolving conflicts. Without that accountability, discrepancies between systems get escalated to whoever built the dashboard, which is the wrong person.
A single source of truth does not mean one database. It means one agreed-upon definition and one authoritative system of record for each key metric. Document it in your data dictionary, link it to your reporting layer, and make it visible to every analyst on the team. When someone questions a number, the answer should be a link, not a meeting.
The 7-Step Business Intelligence Strategy Roadmap
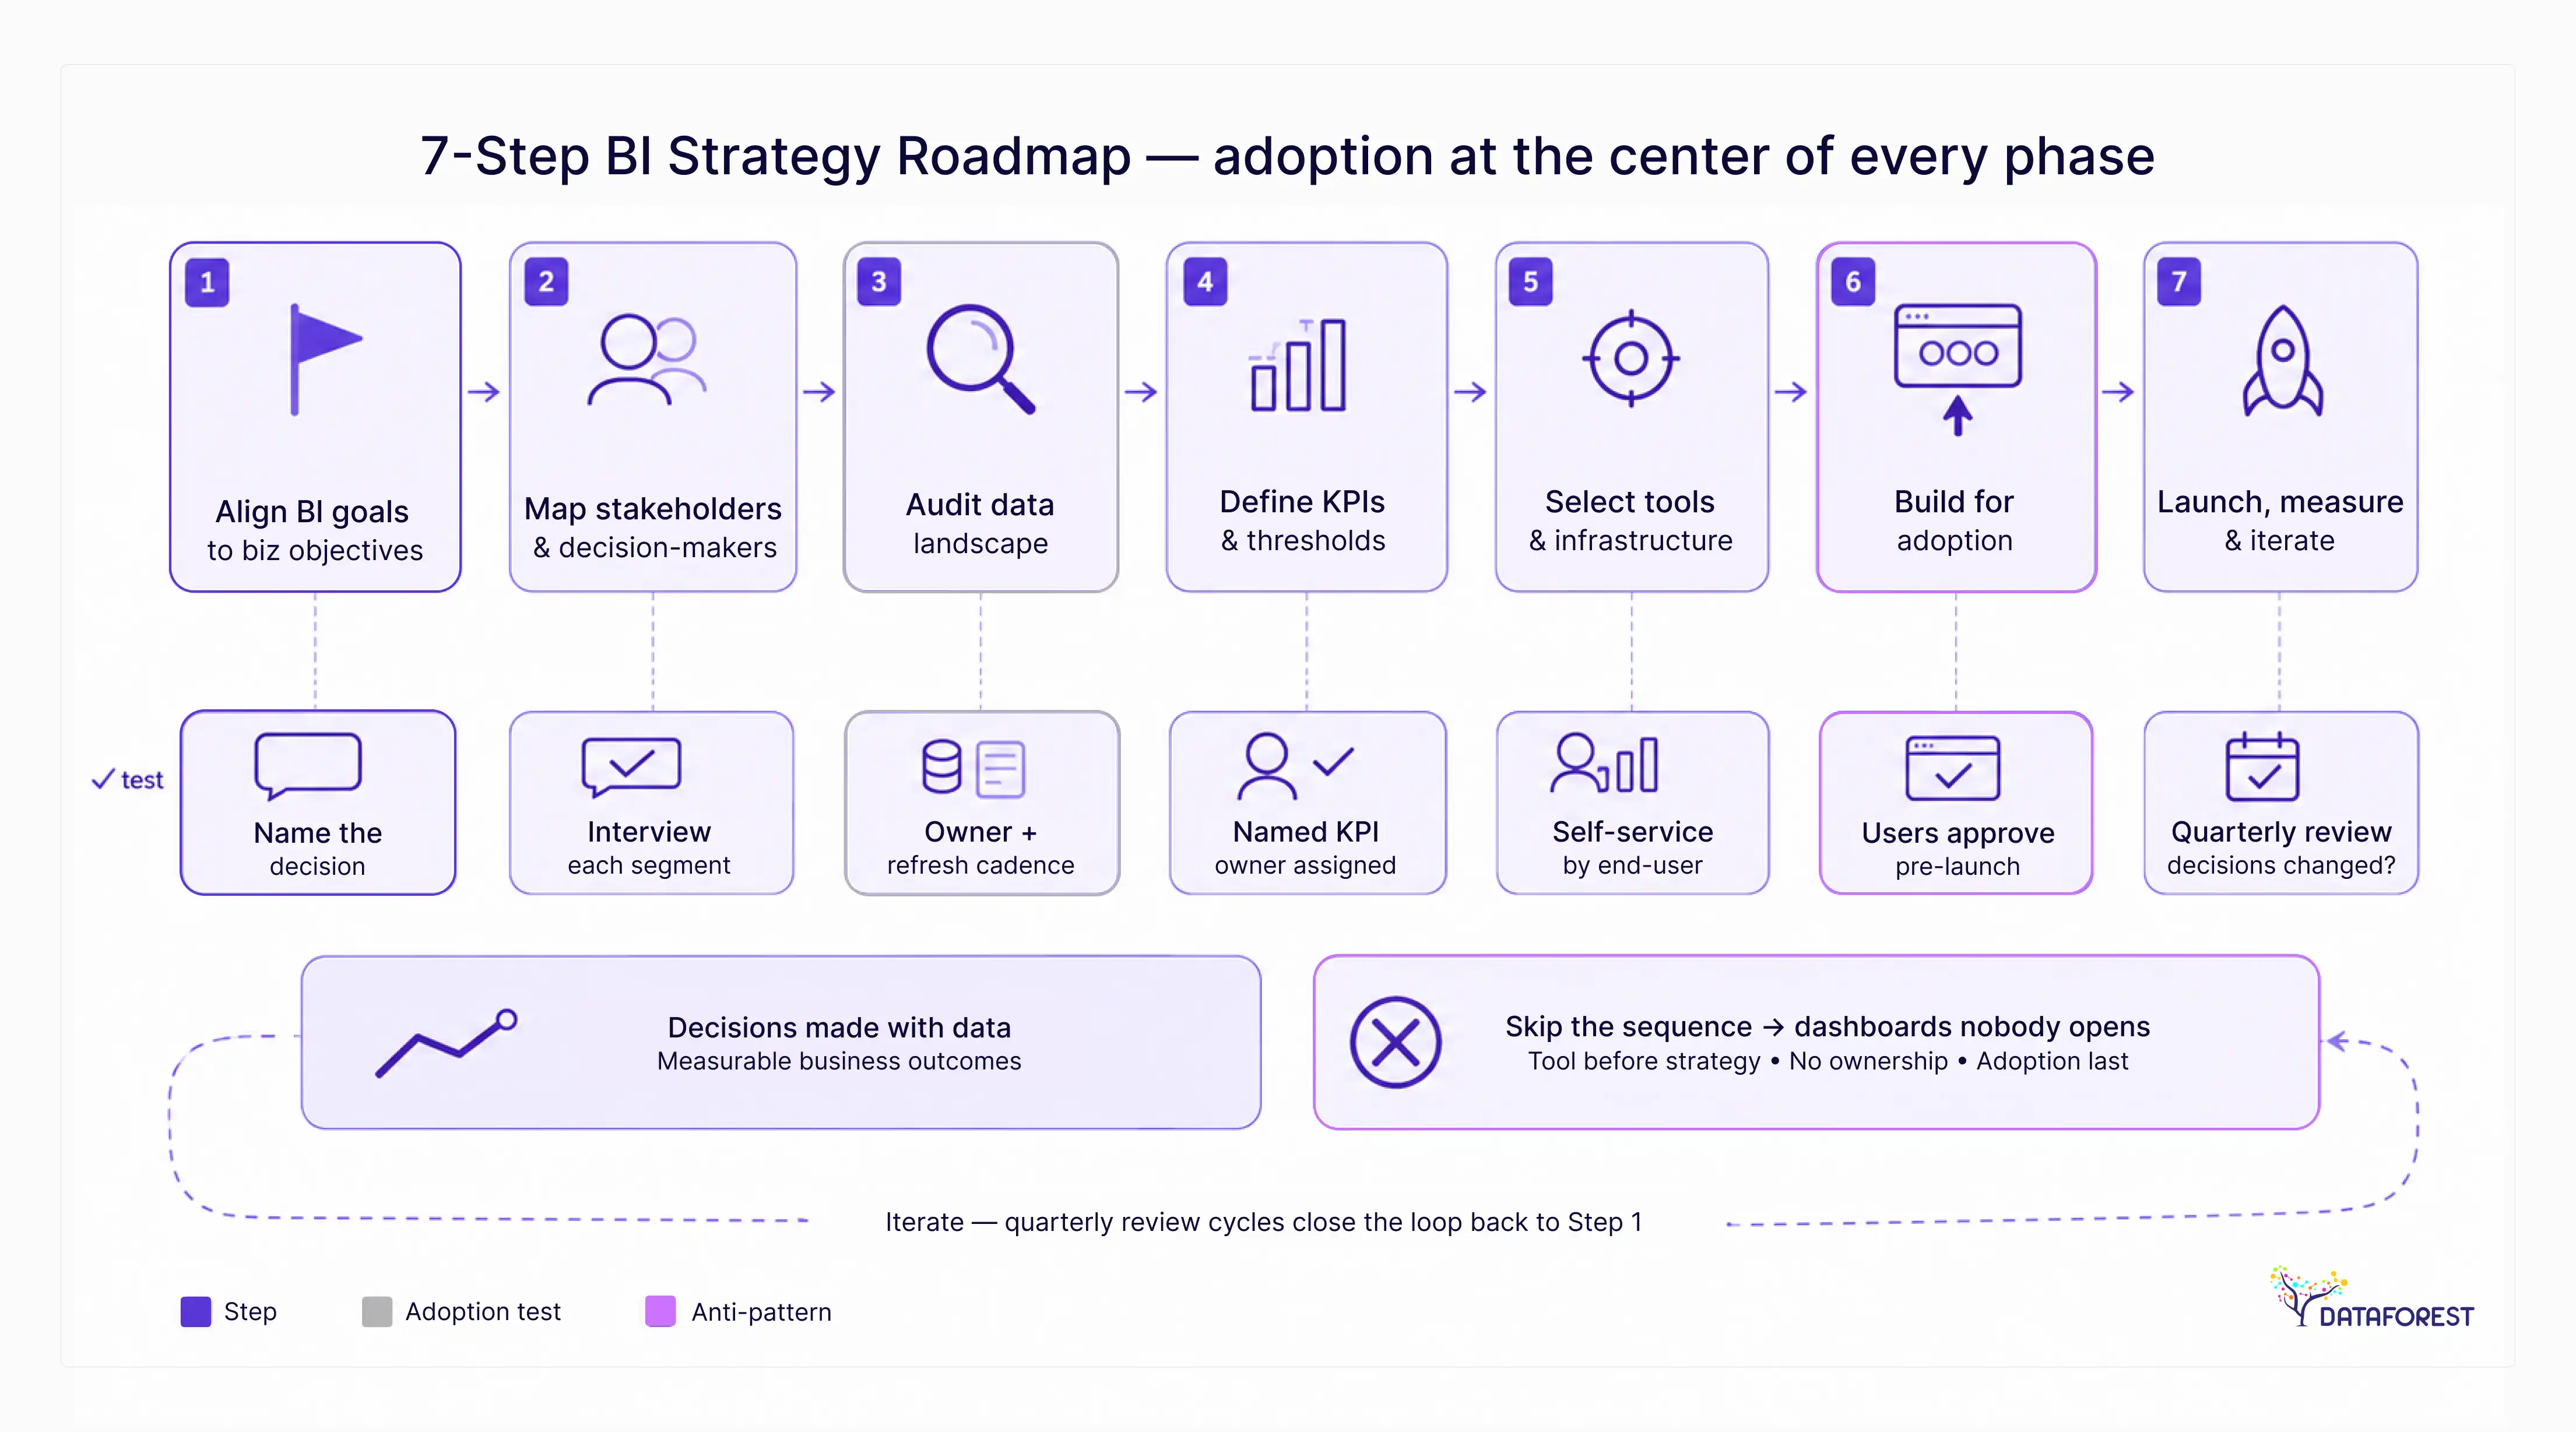
Building a business intelligence strategy means sequencing seven decisions in the right order—and checking at each step whether real users will actually engage with the output. Skip the sequence, and you get dashboards nobody opens. The 7-Step BI Strategy Roadmap below is designed to put adoption at the center of every phase, not as an afterthought at the end.
Step 1: Align BI goals to business objectives
Start with the business problem, not the data. Identify two or three decisions your leadership team makes repeatedly without reliable information - pricing adjustments, inventory calls, churn interventions. BI goals should map directly to those decisions. If you cannot name the decision a report supports, the report probably should not exist.
Adoption test: Can every stakeholder name the specific business decision this BI initiative is meant to improve?
Step 2: Map stakeholders and decision-makers
BI fails when it is built for a generic "user." Instead, map who makes which decisions, how often, and what data they currently rely on. The key segments are executive sponsors who fund the work, operational managers who act on daily outputs, and analysts who maintain the system—each needs a different interface and a different level of detail.
Adoption test: Have you interviewed at least one person from each user segment about their current decision-making workflow?
Step 3: Audit your current data landscape
Before selecting a single tool, document what data you already have, where it lives, how clean it is, and who owns it. Most organizations discover they have more data than they thought, and less of it is trustworthy than they assumed. This audit feeds directly into your governance framework and prevents the most common BI failure: building on unreliable foundations.
Adoption test: Is there a documented owner for each critical data source, with a defined refresh cadence?
Step 4: Define KPIs and reporting requirements
Translate business objectives into specific metrics. For each KPI, define the calculation method, the data source, the update frequency, and the threshold that triggers action. Vague metrics like "improve customer satisfaction" become unusable in practice. "NPS score, measured monthly from post-purchase survey responses, with a threshold alert below 40," is actionable.
Adoption test: Does each KPI have a named owner who will act when the metric moves?
Step 5: Select tools and infrastructure
Tool selection follows strategy—it does not precede it. Match your tooling to your maturity level, your team's technical skills, and the reporting cadence your users actually need. A self-service BI platform is the right call for organizations where business users need to explore data independently; a centralized reporting layer suits teams where analysts handle all queries.
Adoption test: Can your least technical end-user complete their most common reporting task without analyst support?
Step 6: Build for adoption from day one
Stop treating adoption as a post-launch training exercise. Design for it during build. That means co-creating dashboards with the people who will use them, running usability tests before go-live, and establishing a feedback channel so users can flag confusing metrics or missing data. Teams that sustain BI programs over the long term treat their end users as product stakeholders, not recipients.
Adoption test: Have end-users reviewed and approved the dashboard designs before development is complete?
Step 7: Launch, measure, and iterate
A phased rollout beats a big-bang launch. Start with one business unit, measure usage alongside business outcomes, and fix friction before expanding. Track not just whether reports are opened, but whether the decisions they inform are changing. A dashboard viewed daily but never acted on is still a failure.
Adoption test: Do you have a defined review cadence—at least quarterly—to assess whether BI outputs are influencing decisions, not just generating views?
Choosing BI Tools That Match Your Strategy
A BI strategy defines which decisions you need to make and which data support them. A data strategy defines how your organization collects, stores, governs, and manages data as an asset. They overlap—good BI depends on clean data—but BI strategy is decision-focused while data strategy is infrastructure-focused. You need both, but they answer different questions.
What the tool selection decision actually depends on
Most tool selection debates start with features. That's the wrong starting point. The right question is: who needs to answer business questions, and can they do it without filing a ticket to the data team?
If every insight request still routes through an analyst, your tooling is a bottleneck, not an enabler. Tool selection should follow your strategy, not precede it. Four variables drive the decision: the use case, team size, data volume, and the extent of self-service capability your business users actually need.
BI Tool Decision Matrix: company size, data complexity, and self-service need
Pricing varies—verify current rates at each vendor's site before budgeting.
Self-service BI and democratizing data access
Self-service BI is the clearest test of whether a business intelligence strategy is actually working. If a marketing manager still needs to wait two days for a report, the strategy has not succeeded—regardless of how sophisticated the underlying infrastructure is.
The goal is not to eliminate analysts. It is to reserve analyst time for complex modeling while business users handle routine questions themselves. Teams that reach this state typically invest in two things beyond the tool itself: a governed data layer that makes self-service safe, and training that builds data literacy alongside the rollout.
Tool selection is a means, not an end. Pick the platform that matches where your team is today, with a clear path to where self-service capability needs to be in twelve months.
Why BI Strategies Fail: A Failure Mode Catalog
Most BI programs don't fail at the technology layer—they fail at the design layer. A poorly structured BI strategy can make decisions harder, not easier, by adding reporting overhead without improving the quality of the decisions that actually matter. The five failure modes below account for the majority of abandoned BI programs. Each one is diagnosable before it becomes fatal.
Failure Mode 1: Strategy built for IT, not for decision-makers
When BI is scoped by technical teams without input from the managers and analysts who will use it daily, the outputs answer questions IT finds interesting rather than questions the business is actually asking. The diagnostic question: Can every dashboard be traced back to a named decision that a specific role needs to make?
Failure Mode 2: Data quality problems hidden until launch
Data issues discovered after dashboards go live destroy trust immediately—and trust, once lost, is nearly impossible to rebuild. Teams stop using the tool and revert to spreadsheets. The diagnostic question: Have business users validated source data against known outcomes before any report goes to production?
Failure Mode 3: Tool selection before goal definition
Buying a platform before defining what decisions it needs to support is the single fastest way to misalign budget and outcomes. The tool shapes what gets measured, which shapes what gets managed. The diagnostic question: Does your shortlist of tools exist because of specific reporting requirements, or because of a vendor demo?
Failure Mode 4: No executive sponsor or change management plan
Without an executive sponsor, BI competes with every other priority and loses. Change management is not optional—it determines whether adoption happens at all. The diagnostic question: Is there a named executive accountable for BI adoption metrics, not just BI delivery?
Failure Mode 5: Success is never defined, so failure is invisible
If no one has defined what a successful BI program looks like, no one can tell when it has failed. Programs drift, budgets renew, and dashboards accumulate without anyone asking whether the investment is working. The diagnostic question: Do you have a documented definition of BI success that predates your first dashboard?
Failure Mode Red Flags with Diagnostic Questions
- Strategy built for IT, not for decision-makers—Can every report be traced to a named decision that a specific role needs to make?
- Data quality problems hidden until launch—Have business users validated source data against known outcomes before production?
- Tool selection before goal definition—Does your tool shortlist exist because of specific requirements, or a vendor demo?
- No executive sponsor or change management plan—Is there a named executive accountable for adoption metrics, not just delivery?
- Success is never defined, so failure is invisible—Do you have a documented definition of BI success that predates your first dashboard?
How to Measure Whether Your BI Strategy Is Working
Measure BI strategy success by tracking the health of the program itself—not just the business outcomes it supports. The six core meta-KPIs are dashboard adoption rate, decision-to-data latency, self-service query volume, data quality incident rate, stakeholder satisfaction score, and time-to-insight. Together, they tell you whether people are actually using what you built.
Why measuring the BI program itself is different from measuring business KPIs
Revenue growth and customer retention are downstream of dozens of decisions. Attributing them solely to BI is nearly impossible, and doing so usually produces inflated claims that erode internal credibility. Program-level metrics differ: they measure whether the BI system is being used correctly, trusted, and embedded in daily decision-making. That's what you can actually control and improve.
Most teams skip this layer entirely. They report on business KPIs and assume that if the numbers move, BI deserves credit. The problem is that when adoption quietly collapses—dashboards go stale, analysts field the same ad-hoc requests they always did—no one notices until the program is already failing.
BI Adoption Health Scorecard: 6 meta-KPIs for program health
The thresholds for dashboard adoption rate (>a measurable share healthy, <a measurable share warning) are industry reference points. Set your own baselines in the first 60 days post-launch based on your organization's size and decision cadence.
Setting thresholds and acting on scorecard results
The thresholds above are starting points, not universal standards. Set your own baselines in the first 60 days post-launch, then define what "healthy" looks like for your organization's size and decision cadence. Review the scorecard monthly for the first two quarters, then quarterly once the program stabilizes.
When a metric hits a warning signal, treat it as a diagnostic prompt rather than a verdict. A low dashboard adoption rate usually points to relevance or access problems rather than tool failure. High data-quality incident rates almost always trace back to governance gaps that predated the BI rollout. Declining self-service query volume often means training was insufficient or the tool's UX is creating friction.
The scorecard works best when it's owned by a named person—a BI program manager or analytics lead—who presents results to the executive sponsor on a fixed cadence. Without that ownership, the metrics get collected but never acted on, which is the same failure mode the scorecard is designed to prevent.
Business Intelligence Strategy by Industry
The priorities, data sources, and stakeholder dynamics differ enough across verticals that a generic roadmap leaves real gaps—the table below maps those differences directly.
Enterprise BI strategy: governance, scale, and cross-functional alignment
Large enterprises typically struggle less with data volume than with data fragmentation—finance uses one definition of revenue, sales uses another. The practical fix is a governed semantic layer that enforces shared metric definitions before any dashboard gets built. Cross-functional alignment requires a steering committee with representatives from each major business unit, not just IT.
Retail BI strategy: real-time inventory, customer behavior, and demand forecasting
Retail BI lives or dies on data freshness. A markdown decision based on week-old sell-through data incurs a margin cost. Retailers that get the most from BI connect point-of-sale, e-commerce, and supply chain data into a single pipeline, then give merchandising teams self-service access to that feed. The highest-value use cases—promotional lift analysis, shrink detection, and next-best-offer modeling—all depend on that unified foundation.
Pharma BI strategy: regulatory compliance, clinical data, and R&D pipeline visibility
Pharma BI operates under a compliance constraint that most other industries don't face: every data transformation touching a regulated study must be auditable and reproducible. That means your BI infrastructure needs validated environments, controlled access, and documented change management before you build a single clinical dashboard. The payoff is pipeline visibility—knowing which compounds are on track, which trials are at risk of delay, and where R&D spend is concentrated.

Building a BI Strategy That Sticks: Key Takeaways and Next Steps
Most BI programs don't fail at the technology layer. They fail because the strategy was designed to produce dashboards rather than decisions. Everything covered in this guide points back to that single distinction.
The adoption-first checklist before you launch
Before you go live with any BI initiative, run through these checks. If you can't answer yes to most of them, delay the launch—not indefinitely, but long enough to close the gaps.
- Business objectives are documented, and each BI use case maps to at least one of them
- A named executive sponsor has committed to visible, ongoing support
- Data ownership is assigned for every primary data source in scope
- A single source of truth is defined for your top five reporting metrics
- End users were involved in requirements gathering, not just IT
- Dashboards were tested with actual users before rollout, not just QA'd technically
- A training plan exists and is scheduled, not aspirational
- Success metrics for the BI program itself are defined and baselined
- A feedback loop is in place so users can flag data quality issues
- A named owner is responsible for ongoing content and metric maintenance
Where to start based on your maturity score
Your maturity score from the self-assessment earlier determines your first move—not your ambition level.
Start where you are, not where you want to be. A Level 2 organization that tries to deploy predictive analytics will burn budget and lose stakeholder trust. A Level 2 organization that nails metric standardization builds the credibility to move to Level 3 within a year.
As AI-assisted analytics becomes standard infrastructure, data volume ceases to be the differentiator. The organizations that make better decisions will be the ones that invested in governance and trust before they invested in more dashboards.
Governance, maturity assessment, and stakeholder alignment are not bureaucratic overhead. Skip them, and you get reports nobody reads. Do them first, and you get a program people actually use.
Start this week with your maturity score. Work through the five dimensions in the self-assessment, identify your lowest-scoring area, and make that the first problem your BI strategy solves. One honest gap addressed early is worth more than a comprehensive roadmap that never gets off the slide deck.


.webp)

.webp)
.webp)


